Field Notes
<--2022-03-10 11:30:00 | 2022-04-12 16:00:00-->Other sites visited today: Tonzi
Phenocam link: Searching...
Vaira: 2022-03-24 11:10:00 (DOY 83)
Author: Joe Verfaillie
Others:
Summary: Tress near full leaves, dry ground, standard data collection, removed broken Moisture Point probes
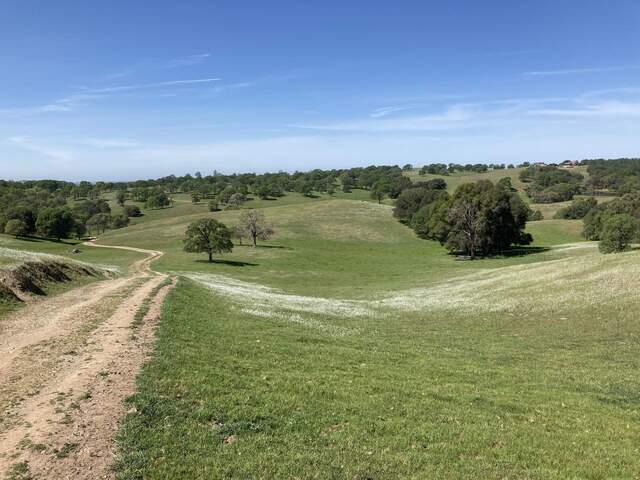
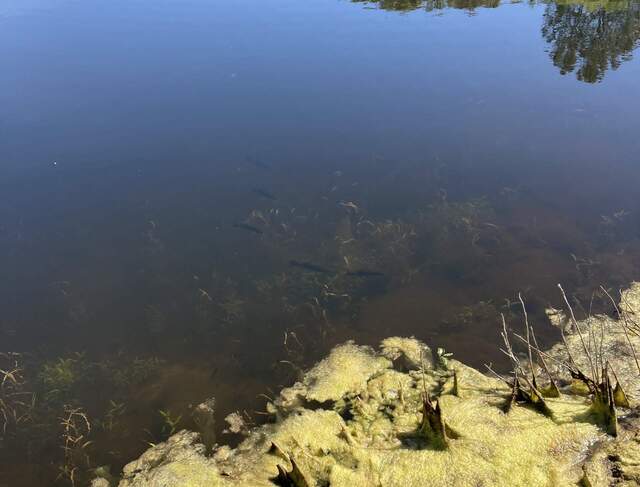
| Vaira 2022-03-24 I arrived at about 11:10 PDT. It was clear, sunny and warm with a light breeze from the west. There were some cows around but spread out and now moving around much. There are lots of flowers and some brown looking patches. The trees are almost fully leafed out. The water hole is still almost full but the ground surface is dry and the road is dusty. Some of the more rocky/rutted parts of the road have been “smoothed” with a tractor. I measured the well level, and collected the met, flux, camera and FD data. There was a small power outage in the early morning on the 20th. Looks like a classic solar power outage, but might be a loose/poor connection when the battery voltage got low and more amps had to flow. Check for loose screws and wire breaks next time. I removed the three moisture point probes that have been broken for a long while now. sn 000007933FDE – Near the eddy tower, top and bottom pin broken sn 00000128B97F3 – Near the solar panels, top and bottom pin broken sn 00000128BDDE8 – At the biomass fence, one pin broken I went to the pond – the stream is full. The pond water was very clear and I could see a bunch of 30cm fish. There were also some turkeys below the dam, some Canada geese left when I arrived and more ducks moved to the far end of the pond. I left at about 12:20 PDT |
Field Data
No tank data
Well Depth
| Date | Location | Depth (feet) |
|---|---|---|
| 2022-03-24 | VR_well | 53.3 |
| 2022-03-24 | VR_pond | 18.72 |
| 2022-03-24 | TZ_floor | 25.4 |
| 2022-03-24 | TZ_road | 33.65 |
| 2022-03-24 | TZ_tower | 28.9 |
mode = both
Moisture Point Probes TZ
Array
(
[0] => Tower_1
[1] => Floor_South_1
[2] => Soil_Transect_3_1
[3] => Soil_Transect_2_1
[4] => Soil_Transect_1_1
[5] => SoilCO2_West_A_1
[6] => SoilCO2_West_B_1
[7] => SoilCO2_West_C_1
[8] => Tower_2
[9] => Floor_South_2
[10] => Soil_Transect_4_2
[11] => Soil_Transect_3_2
[12] => Soil_Transect_2_2
[13] => Soil_Transect_1_2
[14] => SoilCO2_West_A_2
[15] => SoilCO2_West_B_2
[16] => Tower_3
[17] => Floor_South_3
[18] => Soil_Transect_4_3
[19] => Soil_Transect_3_3
[20] => Soil_Transect_2_3
[21] => Soil_Transect_1_3
[22] => SoilCO2_West_A_3
[23] => SoilCO2_West_B_3
[24] => SoilCO2_West_C_3
[25] => Tower_4
[26] => Soil_Transect_4_4
[27] => Soil_Transect_3_4
[28] => Soil_Transect_2_4
[29] => Soil_Transect_1_4
[30] => SoilCO2_West_A_4
[31] => SoilCO2_West_B_4
[32] => SoilCO2_West_C_4
[33] => Soil_Transect_4_1
[34] => SoilCO2_West_C_2
[35] => Floor_South_4
)
| Date | DOY | Rep | Depth | Tower_1 |
Floor_South_1 |
Soil_Transect_3_1 |
Soil_Transect_2_1 |
Soil_Transect_1_1 |
SoilCO2_West_A_1 |
SoilCO2_West_B_1 |
SoilCO2_West_C_1 |
Tower_2 |
Floor_South_2 |
Soil_Transect_4_2 |
Soil_Transect_3_2 |
Soil_Transect_2_2 |
Soil_Transect_1_2 |
SoilCO2_West_A_2 |
SoilCO2_West_B_2 |
Tower_3 |
Floor_South_3 |
Soil_Transect_4_3 |
Soil_Transect_3_3 |
Soil_Transect_2_3 |
Soil_Transect_1_3 |
SoilCO2_West_A_3 |
SoilCO2_West_B_3 |
SoilCO2_West_C_3 |
Tower_4 |
Soil_Transect_4_4 |
Soil_Transect_3_4 |
Soil_Transect_2_4 |
Soil_Transect_1_4 |
SoilCO2_West_A_4 |
SoilCO2_West_B_4 |
SoilCO2_West_C_4 |
Soil_Transect_4_1 |
SoilCO2_West_C_2 |
Floor_South_4 |
Avg | Spacial Count |
Measurement Count |
|---|---|---|---|---|---|---|---|---|---|---|---|---|---|---|---|---|---|---|---|---|---|---|---|---|---|---|---|---|---|---|---|---|---|---|---|---|---|---|---|---|---|---|
| 2022-03-24 | 83 | 0 | nan | 17.3 | 8.8 | 13.8 | 15 | 10.9 | 18.8 | 14.1 | 8.6 | 23.1 | 11.1 | 11.2 | 21 | 21.3 | 9.7 | 16.1 | 7.5 | 25.8 | 26.8 | 15.9 | 22.1 | 25.7 | 25.1 | 24.6 | 25.1 | 18.4 | 35.7 | 19.3 | 27.4 | 40 | 23.9 | 34 | 25.6 | 26.2 | ||||||
| 2022-03-24 | 83 | 1 | nan | 16.5 | 11.5 | 13.2 | 9.1 | 10.9 | 19.1 | 14.4 | 9.4 | 22.8 | 13 | 12.1 | 20.6 | 22.5 | 10 | 16.1 | 7.8 | 26 | 27.1 | 15.6 | 22.1 | 26.5 | 25.7 | 23.7 | 24.8 | 17.6 | 36.5 | 19.9 | 26.8 | 42.8 | 23.6 | 34 | 25.9 | 25.6 | 9.7 | 17.6 | 15.3 | |||
| 2022-03-24 | 83 | 2 | nan | 9.4 | 11.8 | 27.4 | 17.9 | 26.5 | 17 | 16.8 | ||||||||||||||||||||||||||||||||
| 2022-03-24 | 83 | Avg | 0-15cm | 0 | 0 | |||||||||||||||||||||||||||||||||||||
| 2022-03-24 | 83 | Avg | 15-30cm | 0 | 0 | |||||||||||||||||||||||||||||||||||||
| 2022-03-24 | 83 | Avg | 30-45cm | 0 | 0 | |||||||||||||||||||||||||||||||||||||
| 2022-03-24 | 83 | Avg | 45-60cm | 0 | 0 |
No VR Moisture Point data found
No TZ grass heigth found
Grass Height VR 17
| Date | Height reps (cm) | Location | Average | Samp | STDEV | ||||||||||||||||
|---|---|---|---|---|---|---|---|---|---|---|---|---|---|---|---|---|---|---|---|---|---|
| 2022-03-24 | 5 | 2 | 20 | 14 | 7 | 15 | 11 | 7 | 7 | 8 | 5 | 5 | 4 | 5 | 7 | 3 | 7 | GH_ALL | 7.76 | 17 | 4.57 |
No VR Tree DBH found
No water potential data found
No VR Grass Biomass data found
No VR OakLeaves Biomass data found
No VR PineNeedles Biomass data found
2 photos found

20220324VR_FlowersDrySpots.jpg ( 2022-03-24 12:16:11 ) Full size: 1920x1440
Lots of flowers and dry looking spots for this time of year.

20220324VR_PondFish.jpg ( 2022-03-24 12:09:55 ) Full size: 1920x1460
A bunch of fish in the Vaira pond
9 sets found
16 VR_met graphs found
2 VR_flux graphs found
2 VR_soilco2 graphs found
2 VR_pond graphs found
Can't check TZVR_mixed
3 VR_fd graphs found
4 VR_processed graphs found
4 VR_arable graphs found
No data found for VR_soilvue.

