
Field Notes
<--2022-02-09 13:30:00 | 2022-03-10 11:30:00-->Other sites visited today: Tonzi
Phenocam link: Searching...
Vaira: 2022-02-23 10:45:00 (DOY 54)
Author: Joe Verfaillie
Others:
Summary: Dry and cold, talked to Dale, moved calkit PAR, standard data collection
| Vaira 2022-02-23 I arrived at about 10:45 PST. Dale Vaira arrived shortly afterwards. Dale had open heart surgery in November but is up, driving and walking around on his own just three months later – amazing! Dale wanted to go over the pond level reporting forms one more time – I think we have it all straight now. Still almost no rain and the roads are dry but really cold today. It’s sunny and clear but a stiff cold wind from the west. There were signs for chain requirements on Hwy 50 over the mountains. The grass looks good but still grazed down to the nubs. The ground surface is hard and dry though. I didn’t see any cows today. I measured the well and collected the met, flux, FD and camera data. I collected the calkit data and moved the Ameriflux PAR sn 212225 from incoming to reflected. The 7500 read:434.0ppm CO2, 256.5mmol/m3 H2O, 99.9kPa, 9.1C, 100.0SS I did spectral measurements and went to the pond to collect the data. I left at about 12:00 |
Field Data
No tank data
Well Depth
| Date | Location | Depth (feet) |
|---|---|---|
| 2022-02-23 | VR_well | 52.3 |
| 2022-02-23 | VR_pond | 19.84 |
| 2022-02-23 | TZ_floor | 26.05 |
| 2022-02-23 | TZ_road | 35.25 |
| 2022-02-23 | TZ_tower | 29.45 |
mode = both
Moisture Point Probes TZ
Array
(
[0] => Tower_1
[1] => Floor_South_1
[2] => Soil_Transect_4_1
[3] => Soil_Transect_3_1
[4] => Soil_Transect_2_1
[5] => Soil_Transect_1_1
[6] => SoilCO2_West_A_1
[7] => SoilCO2_West_B_1
[8] => SoilCO2_West_C_1
[9] => Tower_2
[10] => Floor_South_2
[11] => Soil_Transect_4_2
[12] => Soil_Transect_3_2
[13] => Soil_Transect_2_2
[14] => Soil_Transect_1_2
[15] => SoilCO2_West_A_2
[16] => SoilCO2_West_B_2
[17] => SoilCO2_West_C_2
[18] => Tower_3
[19] => Floor_South_3
[20] => Soil_Transect_4_3
[21] => Soil_Transect_3_3
[22] => Soil_Transect_2_3
[23] => Soil_Transect_1_3
[24] => SoilCO2_West_A_3
[25] => SoilCO2_West_B_3
[26] => SoilCO2_West_C_3
[27] => Tower_4
[28] => Floor_South_4
[29] => Soil_Transect_4_4
[30] => Soil_Transect_3_4
[31] => Soil_Transect_2_4
[32] => Soil_Transect_1_4
[33] => SoilCO2_West_A_4
[34] => SoilCO2_West_B_4
[35] => SoilCO2_West_C_4
)
| Date | DOY | Rep | Depth | Tower_1 |
Floor_South_1 |
Soil_Transect_4_1 |
Soil_Transect_3_1 |
Soil_Transect_2_1 |
Soil_Transect_1_1 |
SoilCO2_West_A_1 |
SoilCO2_West_B_1 |
SoilCO2_West_C_1 |
Tower_2 |
Floor_South_2 |
Soil_Transect_4_2 |
Soil_Transect_3_2 |
Soil_Transect_2_2 |
Soil_Transect_1_2 |
SoilCO2_West_A_2 |
SoilCO2_West_B_2 |
SoilCO2_West_C_2 |
Tower_3 |
Floor_South_3 |
Soil_Transect_4_3 |
Soil_Transect_3_3 |
Soil_Transect_2_3 |
Soil_Transect_1_3 |
SoilCO2_West_A_3 |
SoilCO2_West_B_3 |
SoilCO2_West_C_3 |
Tower_4 |
Floor_South_4 |
Soil_Transect_4_4 |
Soil_Transect_3_4 |
Soil_Transect_2_4 |
Soil_Transect_1_4 |
SoilCO2_West_A_4 |
SoilCO2_West_B_4 |
SoilCO2_West_C_4 |
Avg | Spacial Count |
Measurement Count |
|---|---|---|---|---|---|---|---|---|---|---|---|---|---|---|---|---|---|---|---|---|---|---|---|---|---|---|---|---|---|---|---|---|---|---|---|---|---|---|---|---|---|---|
| 2022-02-23 | 54 | 0 | nan | 25.8 | 12.7 | 8 | 14.4 | 15.6 | 15 | 21.4 | 21.2 | 14.4 | 30.1 | 13.9 | 16.1 | 26.1 | 27.1 | 13.6 | 20.6 | 20.3 | 22.2 | 31.3 | 34.3 | 19.8 | 26.2 | 39.6 | 29.6 | 29 | 28.5 | 30.4 | 39.7 | 52.3 | 25.4 | 37.1 | 44.8 | 29.4 | 39.1 | 40.5 | 44.8 | |||
| 2022-02-23 | 54 | 1 | nan | 26.4 | 14.5 | 8.3 | 14.4 | 16.2 | 14.7 | 18.2 | 13.2 | 30.1 | 17.9 | 16.1 | 26.5 | 26.8 | 13 | 11.8 | 22.2 | 30.1 | 33.8 | 19.3 | 26.2 | 39.6 | 29.9 | 28.5 | 30.1 | 40.8 | 50.3 | 25.1 | 35.4 | 46.3 | 29.4 | 43.1 | 46.6 | |||||||
| 2022-02-23 | 54 | 2 | nan | 13.2 | 10.6 | 29.3 | 42.5 | |||||||||||||||||||||||||||||||||||
| 2022-02-23 | 54 | Avg | 0-15cm | 0 | 0 | |||||||||||||||||||||||||||||||||||||
| 2022-02-23 | 54 | Avg | 15-30cm | 0 | 0 | |||||||||||||||||||||||||||||||||||||
| 2022-02-23 | 54 | Avg | 30-45cm | 0 | 0 | |||||||||||||||||||||||||||||||||||||
| 2022-02-23 | 54 | Avg | 45-60cm | 0 | 0 |
No VR Moisture Point data found
No TZ grass heigth found
No VR grass heigth found
No VR Tree DBH found
No water potential data found
No VR Grass Biomass data found
No VR OakLeaves Biomass data found
No VR PineNeedles Biomass data found
1 photos found
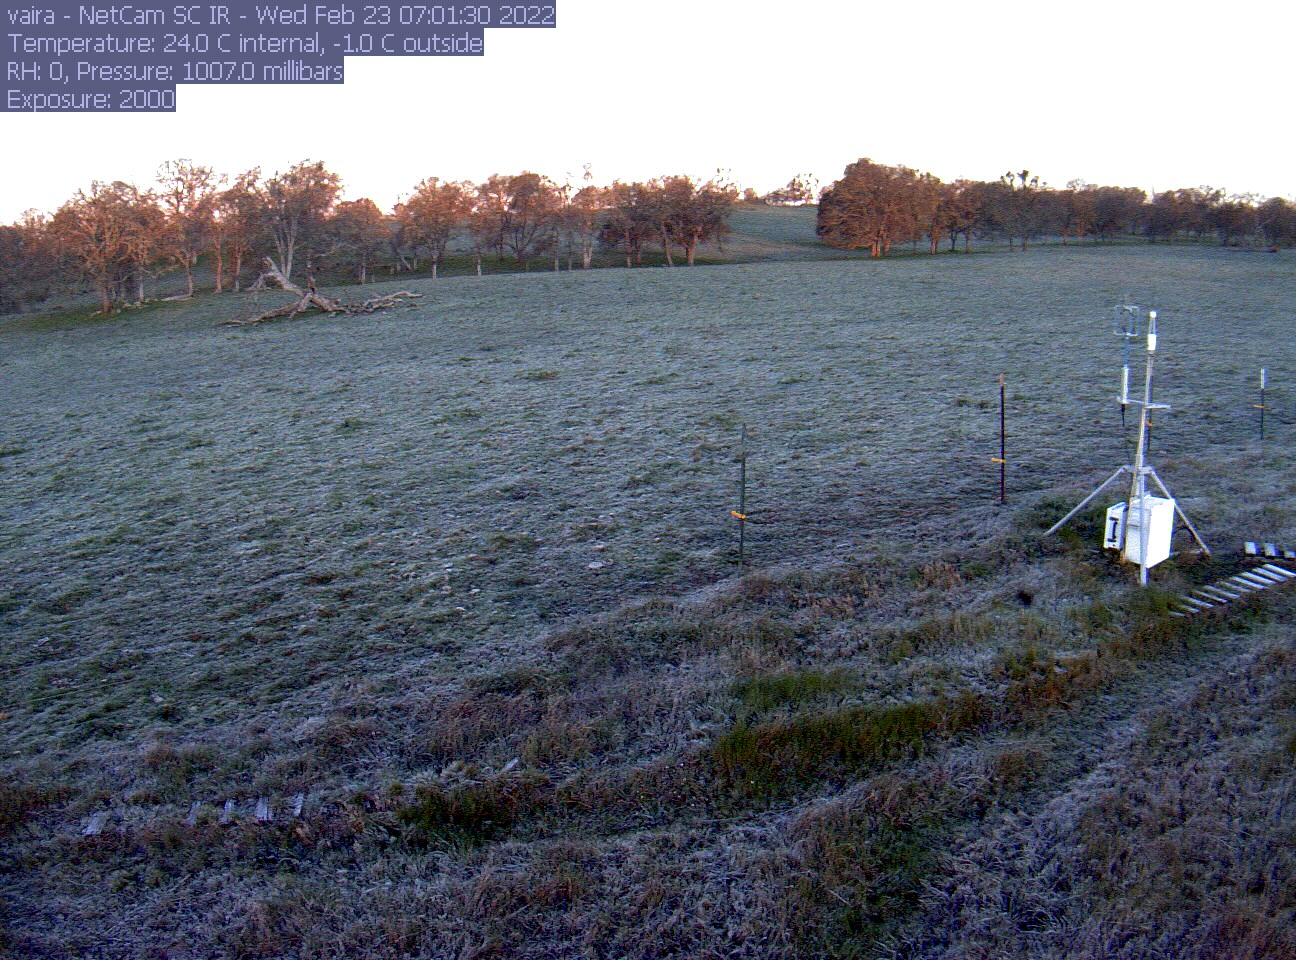
vaira_2022_02_23_070126.jpg ( 2022-02-23 06:54:10 ) Full size: 1296x960
Frost
9 sets found
16 VR_met graphs found
2 VR_flux graphs found
2 VR_soilco2 graphs found
2 VR_pond graphs found
Can't check TZVR_mixed
3 VR_fd graphs found
4 VR_processed graphs found
4 VR_arable graphs found
No data found for VR_soilvue.