
Field Notes
<--2021-12-02 10:15:00 | 2022-01-19 14:00:00-->Other sites visited today: Hill Slough | Vaira
Phenocam link: Searching...
Tonzi: 2022-01-06 11:50:00 (DOY 6)
Author: Daphne Szutu
Others: Dennis
Summary: Power outages, Regular data collection/cleaning, foggy and overcast with wet roads, tree diameters have increased, reset phenocam clock, spectral measurements
| 2022-01-06 Tonzi Dennis and I arrived at 11:50 PST after stopping at Hill Slough to download data this morning. It was cool and foggy with not much breeze. The grass was green and pretty short, although we didn’t see any cows around. The road had some puddles but it was driveable; we stopped and parked on the road by the IRT sensors because the road became much muddier closer to the main tower. The pond looked full and had expanded north to the other side of the small rise. It was quiet and peaceful, and the sun came out in the afternoon as we were leaving. Dennis was out here in May but this is my first time here since March 2020. Joe is in Japan with his family. He gave me detailed notes and a map for where to find everything. Dennis took soil moisture, veg height, and manual well measurements. He also took some spectral measurements in the open area by the IRT tower. Back in the lab I noticed the spectra file times were 14:20-14:22, which doesn't match the times we were at the site (we left around 14:15 and Dennis did not do spectra right before we left). I checked the spectrometer clock and found it ahead by about 1 hour. When the time was 12:42, I changed it to 11:50 to match my computer time. I don't know if the clock drifted or if we accidentally set it to PDT in the past. With this correction, the spectra files were taken around 13:20, which would match with our time at the site. I stopped first at the Latte Panda to see if all the data was there. The IRT data was last updated on 2021-12-12 and the tower met and tower co2prof were last updated on 2021-12-26. I walked to the IRT to unplug and replug the CR1000 power. This worked to send updated data to the Latte Panda. I moved all the files from C:\Data and from C:\Data\OSUData to a USB stick and moved them to datamule. I checked on the data loggers for the tower met and the tower CO2 profile and they seemed fine, so I downloaded the data directly from them, downloading data since 12/1. I think they’re connected to the LattePanda by ethernet. The ethernet connections on both data loggers looked fine with blinky lights, and the ethernet switch at the tower top also looked reasonable. The ethernet connection on the LattePanda behind the screen seemed secure, but I couldn’t see any blinky lights. Since all the data was there and should continue spooling up in the data loggers, I left things as is. Power outage at the Tower on the 27th-28th coincident with several days of low light. Might explain problems with Ethernet connected data loggers. The OSU SP2 system also died at this time and really never recovered. This system doesn't get a lot of sunlight - I might move its power to the Tower system. At the tower top and at the floor, the sensors all looked pretty clean. I downloaded: - Tower USB - Tower phenocam (clock was bad; reset from 2000-01-08 10:41 to 2022-01-06 12:09) - Floor USB - Floor well - Soil CO2 CR23X - Both FD chambers and cleared their memories - IRT CR23X (forgot to rename the file before downloading so all data since 11/17 is in TZ_irt3_23x_20220106.dat) - 3 Zcams, swapped their desiccants, and tested their function - Did not collect the Road well Global Water data While I was waiting for the FD chambers to clear their memories, I walked around to measure the DBH of our various trees. The diameter of most of them increased by around 1mm, although tree 102 increased by almost 5mm from 14.0 to 18.8mm, so in retrospect that might not that right. The soil CO2 fence is not working, but we turned on the main tower electrical fence before leaving. Tower LI-7500 readings: CO2 402ppm H2O 525ppm T 11.5C P 99.3kPa SS 98 Floor LI-7500 readings: CO2 412ppm H2O 571ppm T 12.6C P 99.3kPa SS 104 We left at 14:15 PST to head to Vaira. |
Field Data
No tank data
Well Depth
| Date | Location | Depth (feet) |
|---|---|---|
| 2022-01-06 | TZ_floor | 27.7 |
| 2022-01-06 | TZ_tower | 31.1 |
| 2022-01-06 | TZ_road | 35.1 |
| 2022-01-06 | VR_well | 53 |
mode = both
Moisture Point Probes TZ
Array
(
[0] => Tower_1
[1] => Soil_Transect_4_1
[2] => Soil_Transect_3_1
[3] => Soil_Transect_2_1
[4] => Soil_Transect_1_1
[5] => SoilCO2_West_A_1
[6] => SoilCO2_West_B_1
[7] => SoilCO2_West_C_1
[8] => Tower_2
[9] => Soil_Transect_4_2
[10] => Soil_Transect_3_2
[11] => Soil_Transect_2_2
[12] => Soil_Transect_1_2
[13] => SoilCO2_West_A_2
[14] => SoilCO2_West_B_2
[15] => SoilCO2_West_C_2
[16] => Tower_3
[17] => Soil_Transect_4_3
[18] => Soil_Transect_3_3
[19] => Soil_Transect_2_3
[20] => Soil_Transect_1_3
[21] => SoilCO2_West_A_3
[22] => SoilCO2_West_B_3
[23] => SoilCO2_West_C_3
[24] => Tower_4
[25] => Soil_Transect_4_4
[26] => Soil_Transect_3_4
[27] => Soil_Transect_2_4
[28] => Soil_Transect_1_4
[29] => SoilCO2_West_A_4
[30] => SoilCO2_West_B_4
[31] => SoilCO2_West_C_4
)
| Date | DOY | Rep | Depth | Tower_1 |
Soil_Transect_4_1 |
Soil_Transect_3_1 |
Soil_Transect_2_1 |
Soil_Transect_1_1 |
SoilCO2_West_A_1 |
SoilCO2_West_B_1 |
SoilCO2_West_C_1 |
Tower_2 |
Soil_Transect_4_2 |
Soil_Transect_3_2 |
Soil_Transect_2_2 |
Soil_Transect_1_2 |
SoilCO2_West_A_2 |
SoilCO2_West_B_2 |
SoilCO2_West_C_2 |
Tower_3 |
Soil_Transect_4_3 |
Soil_Transect_3_3 |
Soil_Transect_2_3 |
Soil_Transect_1_3 |
SoilCO2_West_A_3 |
SoilCO2_West_B_3 |
SoilCO2_West_C_3 |
Tower_4 |
Soil_Transect_4_4 |
Soil_Transect_3_4 |
Soil_Transect_2_4 |
Soil_Transect_1_4 |
SoilCO2_West_A_4 |
SoilCO2_West_B_4 |
SoilCO2_West_C_4 |
Avg | Spacial Count |
Measurement Count |
|---|---|---|---|---|---|---|---|---|---|---|---|---|---|---|---|---|---|---|---|---|---|---|---|---|---|---|---|---|---|---|---|---|---|---|---|---|---|---|
| 2022-01-06 | 6 | 0 | nan | 41.7 | 28.5 | 27.6 | 22.9 | 26.7 | 37.6 | 36.1 | 34.3 | 39.6 | 35.9 | 35 | 34.4 | 27.1 | 32.6 | 29.2 | 39.6 | 34.1 | 38 | 36.6 | 36.3 | 36.6 | 37.7 | 41.3 | 38.8 | 42.3 | 34.8 | 48.3 | 49.1 | 41.4 | 46.6 | 50.6 | 48 | |||
| 2022-01-06 | 6 | 1 | nan | 40.8 | 27.9 | 20.9 | 23.2 | 21.7 | 36.7 | 35.5 | 34.3 | 38.4 | 35.3 | 34.7 | 34.4 | 27.1 | 32.6 | 28.3 | 34.4 | 34.3 | 37.7 | 36.8 | 35.2 | 36 | 36.3 | 40.7 | 38 | 40.4 | 35.1 | 45.1 | 48.8 | 41.4 | 45.1 | 50.3 | 46.8 | |||
| 2022-01-06 | 6 | 2 | nan | 42.6 | 27.3 | 28.5 | 23.2 | 19.1 | 36.7 | 36.4 | 34.1 | 40.8 | 35.3 | 34.4 | 33.8 | 27.1 | 32.3 | 29.2 | 34.1 | 33.5 | 37.1 | 36.3 | 34.1 | 36.6 | 36.8 | 41.3 | 37.7 | 43.4 | 34.2 | 44.5 | 48.6 | 40.8 | 45.4 | 50.6 | 47.1 | |||
| 2022-01-06 | 6 | Avg | 0-15cm | 0 | 0 | |||||||||||||||||||||||||||||||||
| 2022-01-06 | 6 | Avg | 15-30cm | 0 | 0 | |||||||||||||||||||||||||||||||||
| 2022-01-06 | 6 | Avg | 30-45cm | 0 | 0 | |||||||||||||||||||||||||||||||||
| 2022-01-06 | 6 | Avg | 45-60cm | 0 | 0 |
No VR Moisture Point data found
No TZ grass heigth found
No VR grass heigth found
Tree DBH
| Date | Tag# | Reading (mm) |
|---|---|---|
| 2022-01-06 | 1 | 17.4 |
| 2022-01-06 | 102 | 18.8 |
| 2022-01-06 | 2 | 15.2 |
| 2022-01-06 | 245 | 5.0 |
| 2022-01-06 | 3 | 20.2 |
| 2022-01-06 | 4 | 16.1 |
| 2022-01-06 | 6 | 20.2 |
| 2022-01-06 | 7 | 9.6 |
| 2022-01-06 | 72 | 13.4 |
| 2022-01-06 | 79 | 13.3 |
No water potential data found
No TZ Grass Biomass data found
No TZ OakLeaves Biomass data found
No TZ PineNeedles Biomass data found
4 photos found
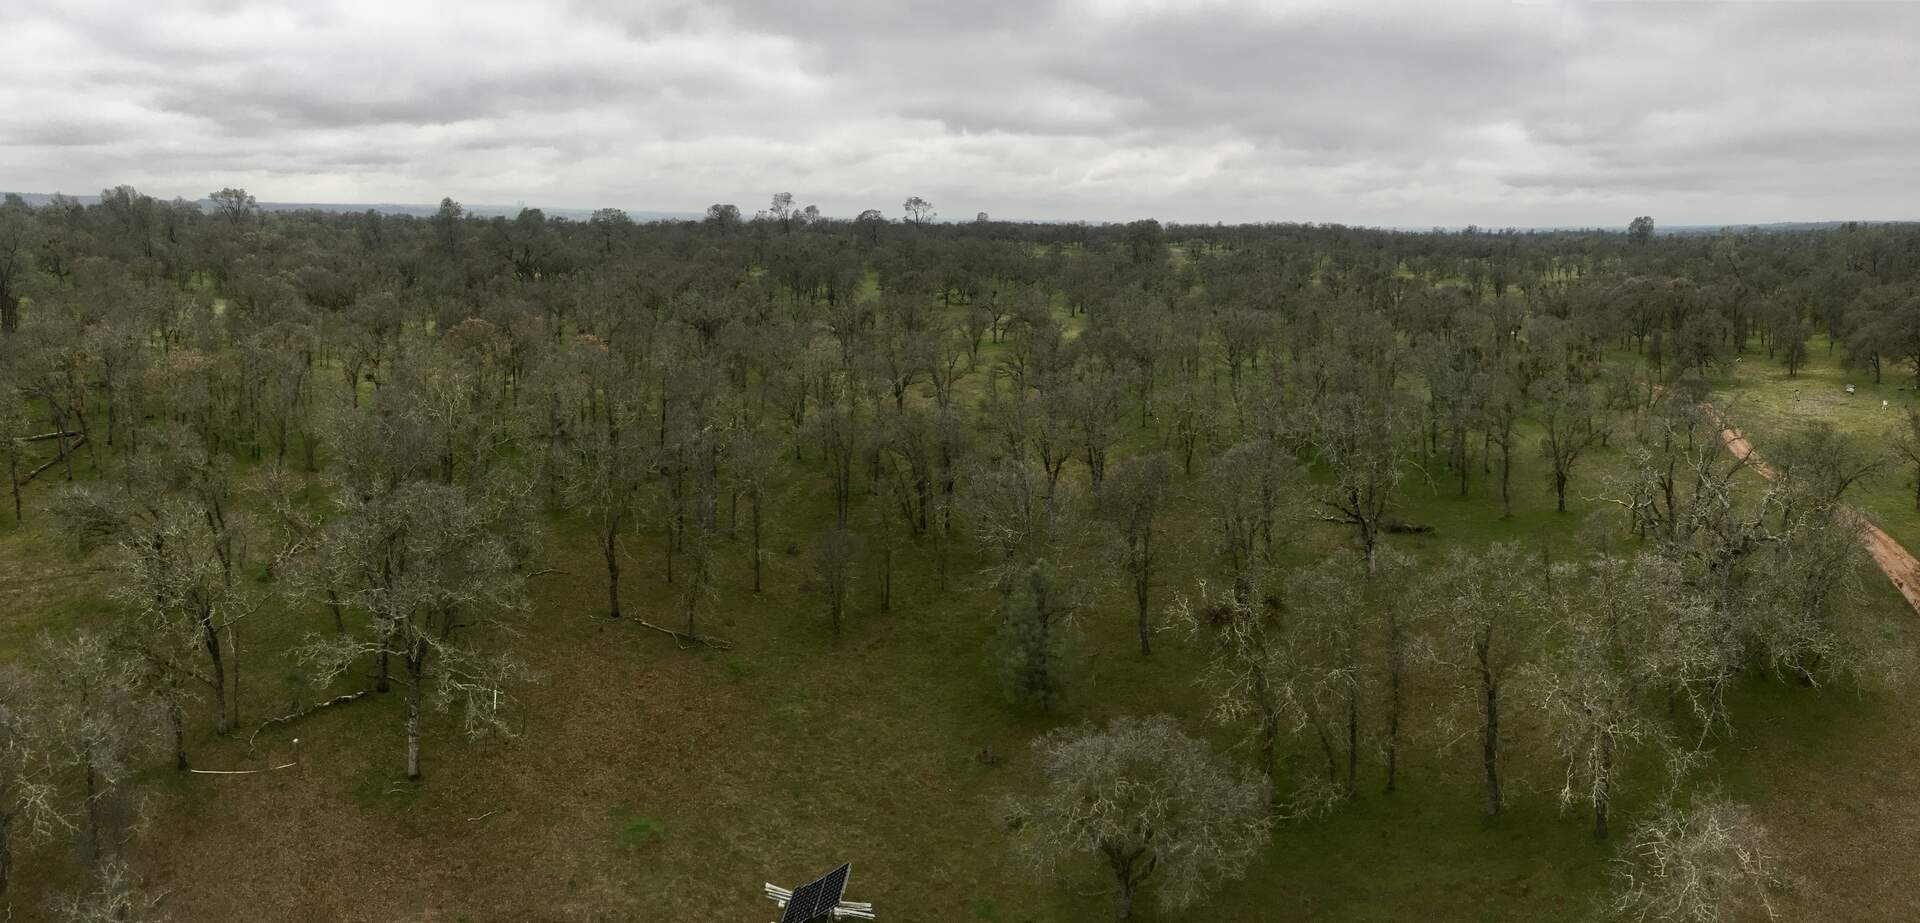
20220106TZ_Pano.jpg ( 2022-01-06 12:14:10 ) Full size: 1920x923
View from top of tower
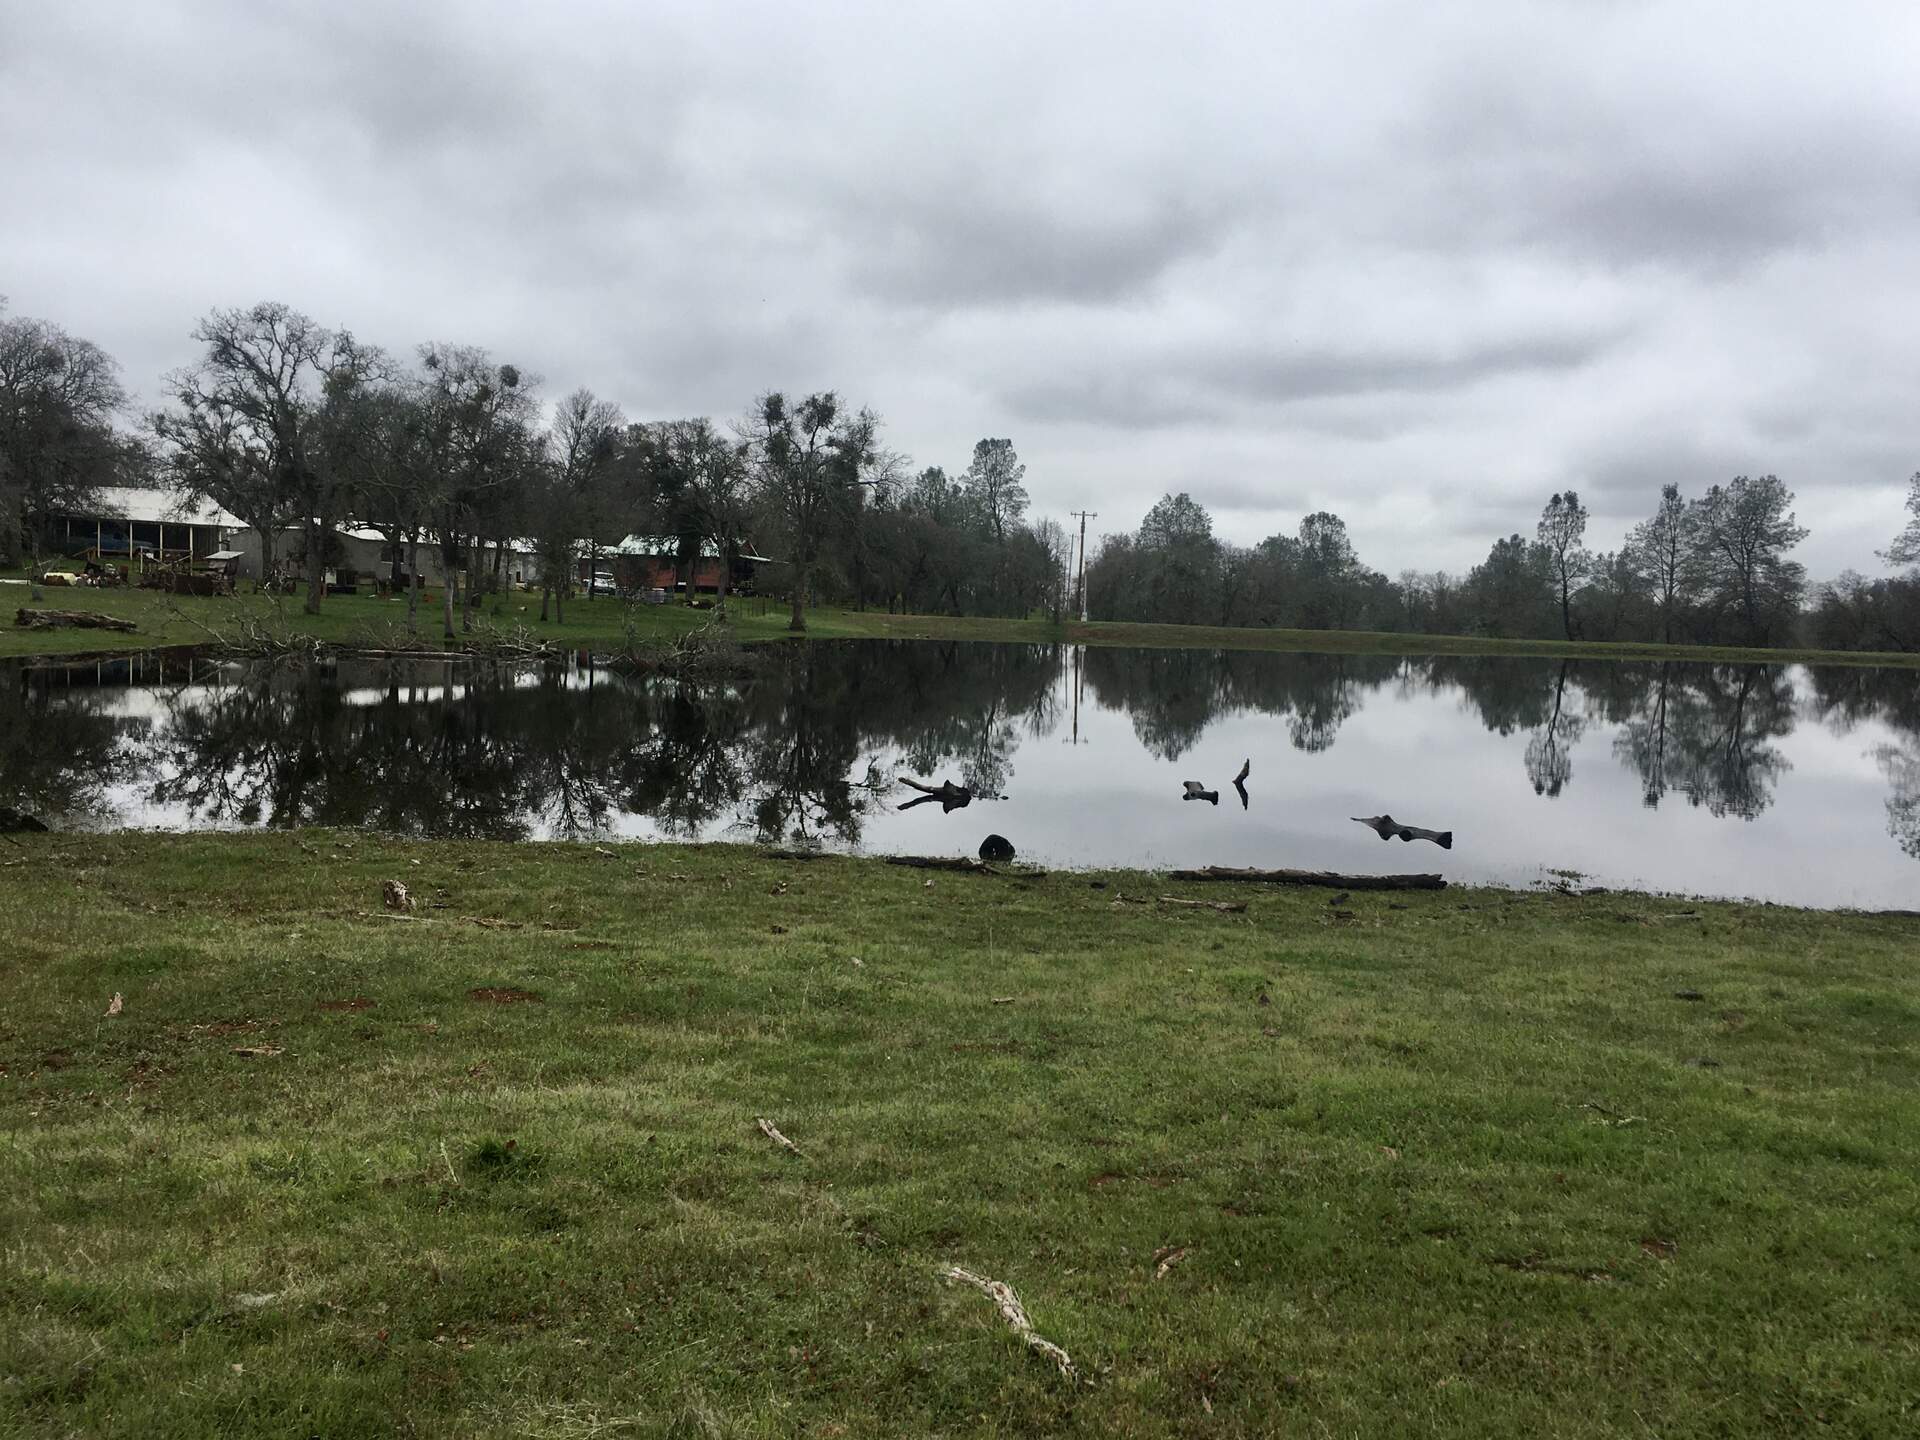
20220106TZ_Pond.jpg ( 2022-01-06 11:48:38 ) Full size: 1920x1440
Skewed view of the pond
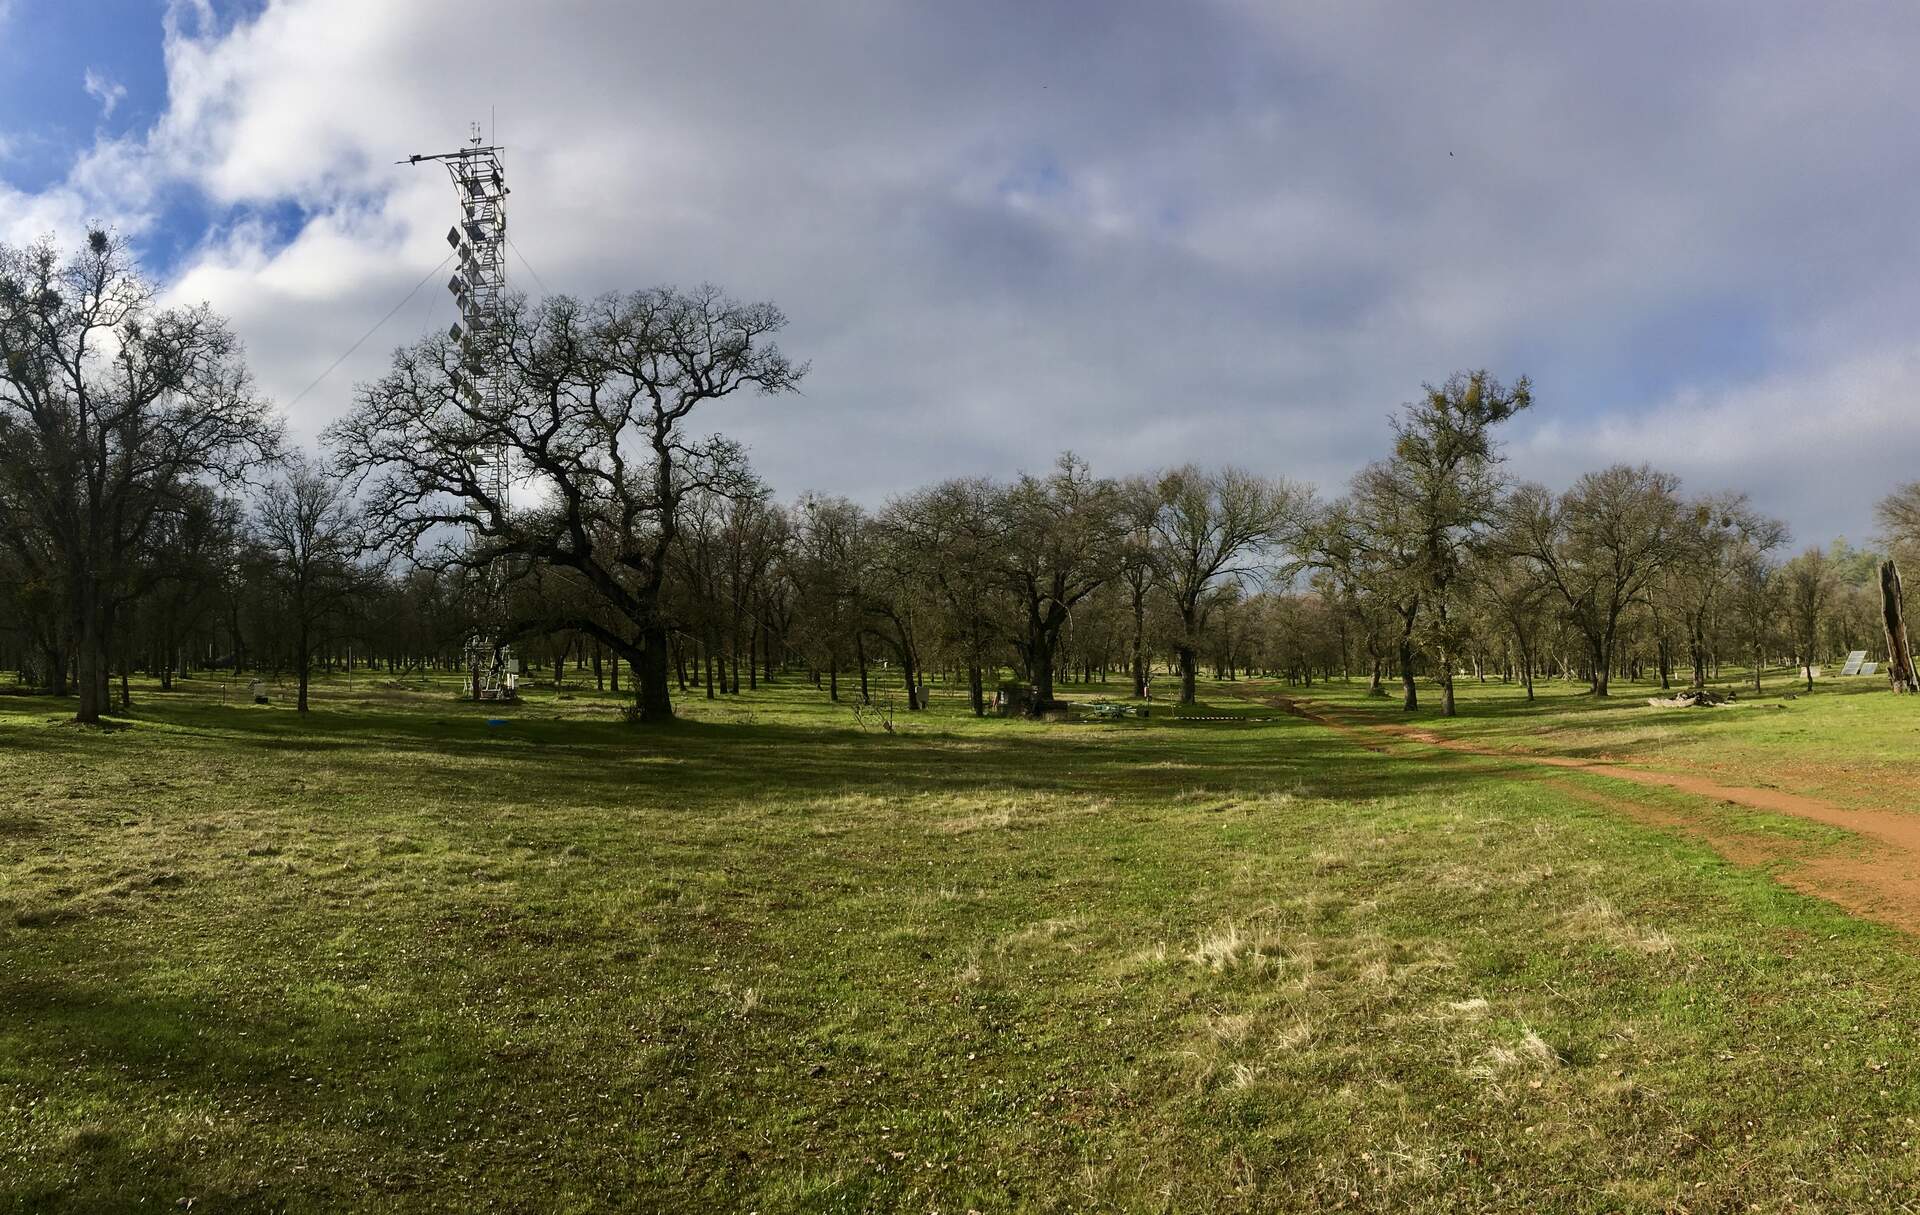
20220106TZ_Tower.jpg ( 2022-01-06 14:13:51 ) Full size: 1920x1215
Short, green grass and bare trees (with mistletoe)
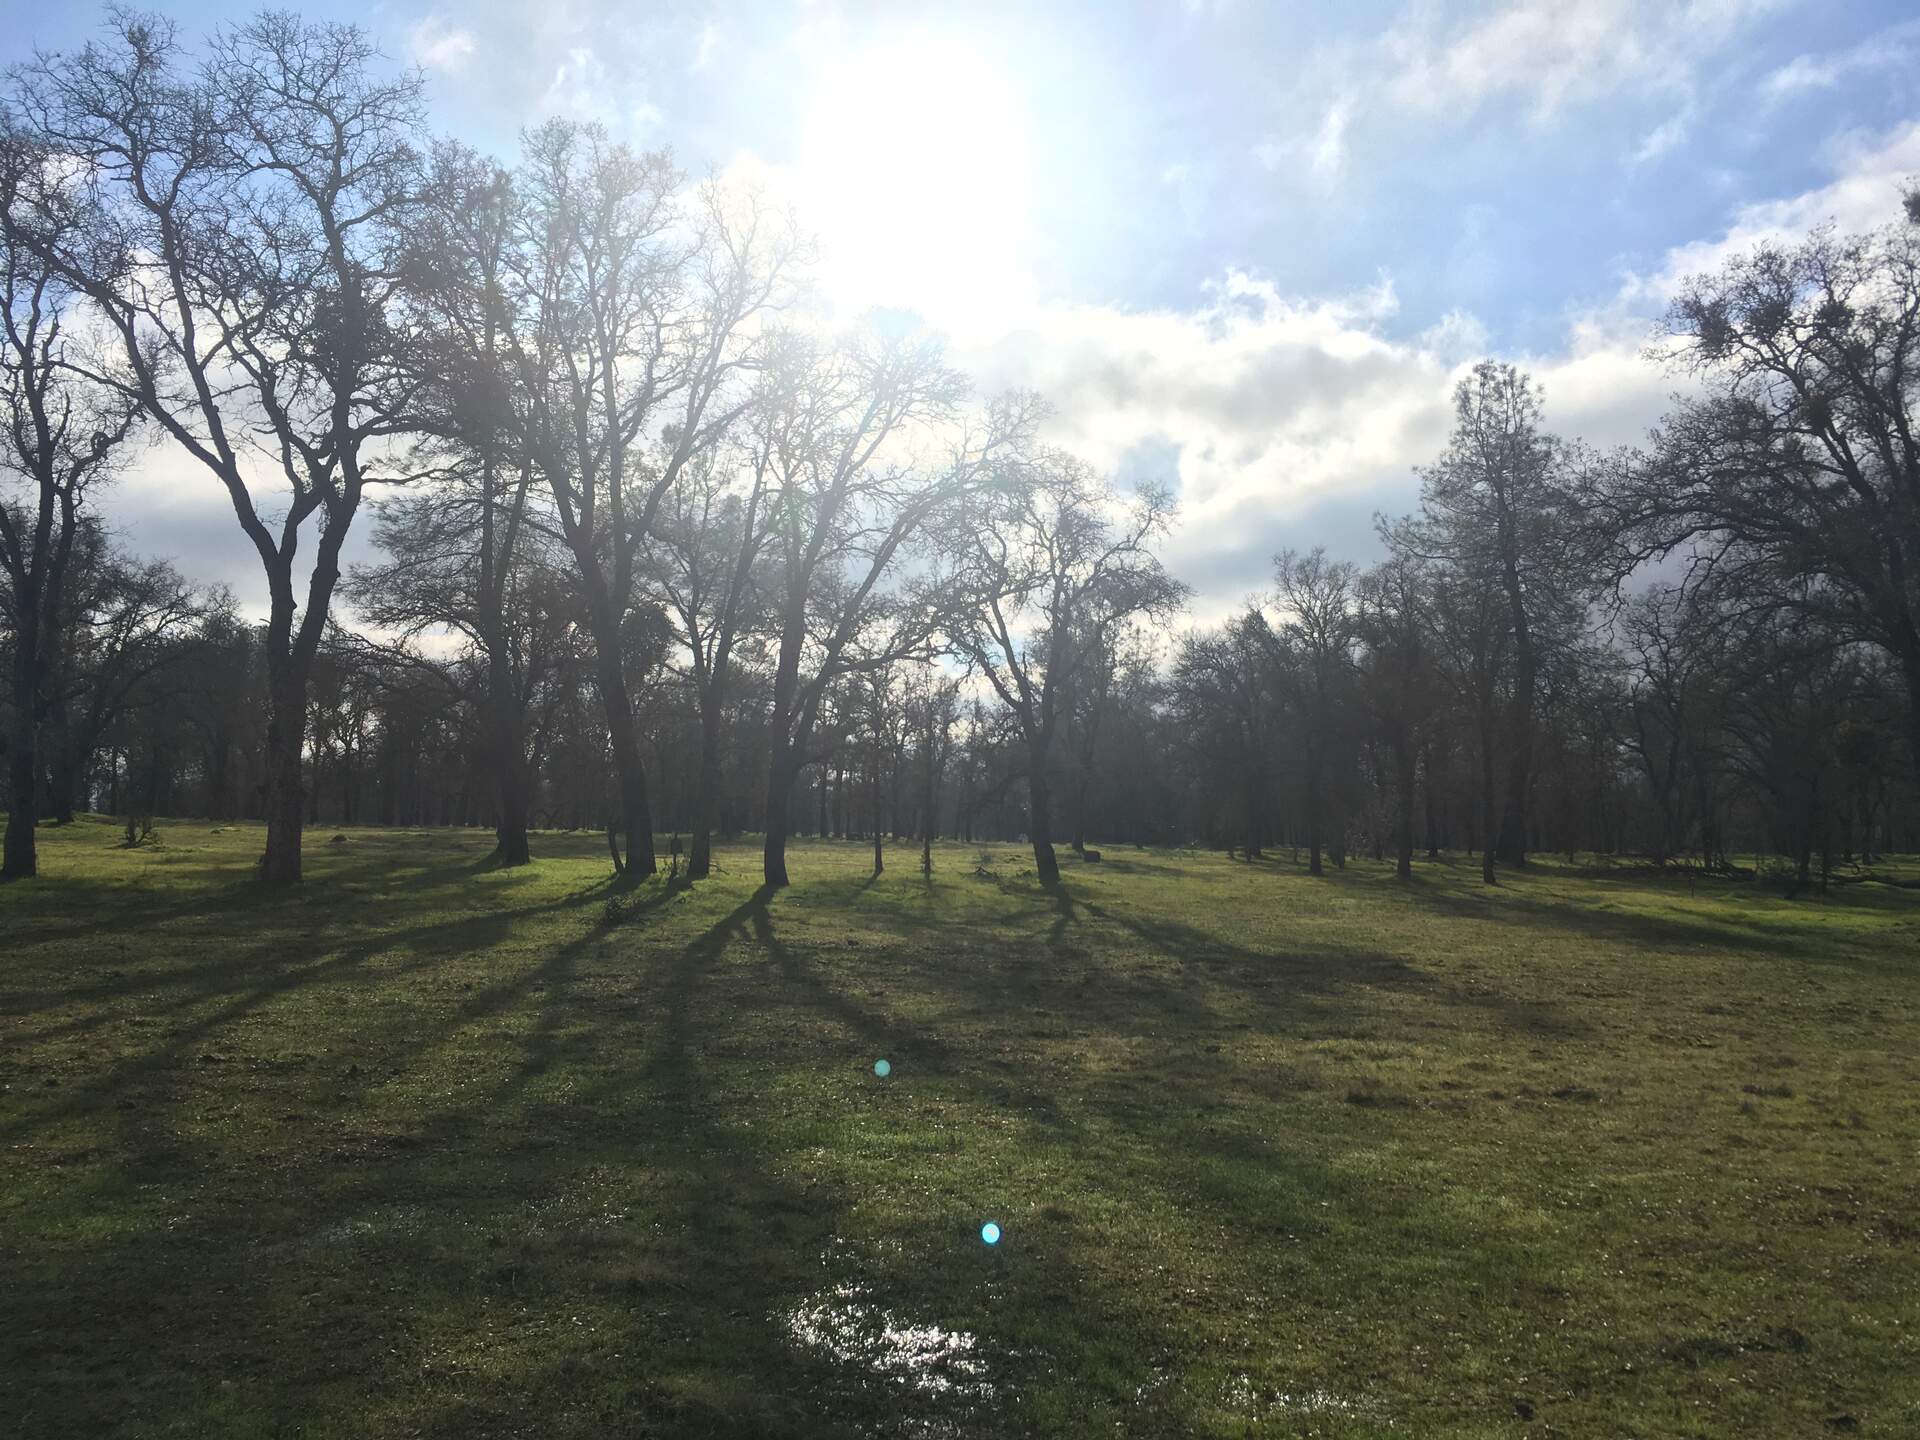
20220106TZ_WinterLight.jpg ( 2022-01-06 14:13:27 ) Full size: 1920x1440
The sun came out in the afternoon. Puddle in the grass from winter rains
16 sets found
No data found for TZ_Fenergy.
11 TZ_tmet graphs found
11 TZ_soilco2 graphs found
Can't check TZ_mixed
3 TZ_mixed graphs found
1 TZ_fflux graphs found
8 TZ_fmet graphs found
No data found for TZ_tram.
3 TZ_co2prof graphs found
1 TZ_irt graphs found
No data found for TZ_windprof.
1 TZ_tflux graphs found
2 TZ_sm graphs found
Can't check TZ_met
1 TZ_met graphs found
Can't check TZVR_mixed
8 TZ_osu graphs found
3 TZ_fd graphs found
Tonzi Z-cam data