Field Notes
<--2021-10-06 11:00:00 | 2021-11-17 11:00:00-->Other sites visited today: Hill Slough | Tonzi
Phenocam link: Searching...
Vaira: 2021-10-26 15:00:00 (DOY 299)
Author: Joe Verfaillie
Others:
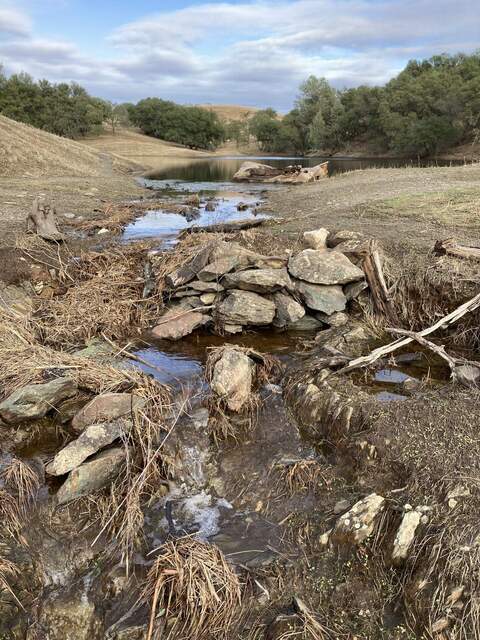
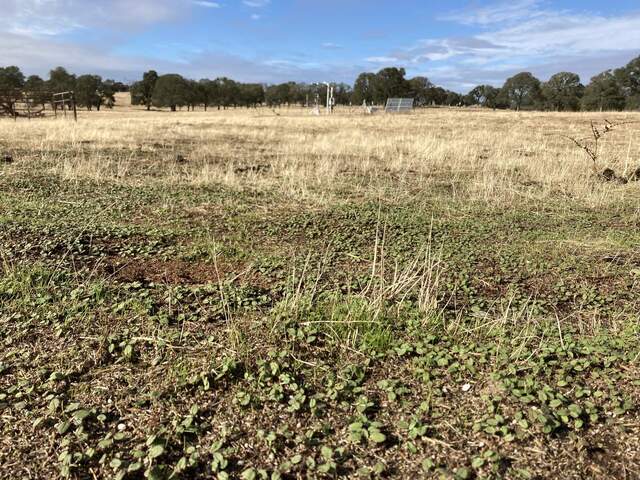
Summary: Pond is full, ground is wet, green sprouts coming up, retested the tipping bucket - ok, brought in pair of unused solar panels.
| Vaira 2021-10-26 I arrive at about 15:00 PDT. It was mostly overcast and cool. Record rains a few days ago have thoroughly wet the ground. There were large puddles and running water in the road. The water hole was full and the pond was full to overflowing. There were lots of broad leave sprouts coming up and some grass. In places where the litter is not too heavy the ground was definitely tinged green. The biomass fence has made its annual move. Lots of cows with babies around. At the tower all looked well. I collected the met, flux, phenocam, and FD data. The 7500 read: 418.2ppm CO2, 457.8mmol/m3 H2O, 100.3kPa, 20.5C, 102.9SS I retested the tipping bucket. I didn’t have the lithium power pack because I left it at Tonzi to power the Road Well. But, the cables were long enough for me to put the CR23X on the boom next to the tipping bucket and power the pump from the 23X 12V ports. The bucket got 49/50 tips – good enough. I brought in the two solar panels, sn 020854E-6-03-02-06905 and sn 020854E-6-03-02-06862, that had been used for the soil CO2 24V power system. I’m hoping to use them to test Elkhorn Slough systems. I took some spectra but the light was a little variable. I left at about 16:30 PDT |
Field Data
No tank data
Well Depth
| Date | Location | Depth (feet) |
|---|---|---|
| 2021-10-26 | TZ_floor | 32.4 |
| 2021-10-26 | TZ_road | 40 |
| 2021-10-26 | TZ_tower | 37.2 |
| 2021-10-26 | VR_well | 60.5 |
| 2021-10-26 | VR_pond | 22.28 |
| 2021-10-26 | HS | 5.29 |
mode = both
Moisture Point Probes TZ
Array
(
[0] => Tower_1
[1] => Soil_Transect_3_1
[2] => Soil_Transect_2_1
[3] => Soil_Transect_1_1
[4] => SoilCO2_West_A_1
[5] => SoilCO2_West_B_1
[6] => SoilCO2_West_C_1
[7] => Tower_2
[8] => Soil_Transect_4_2
[9] => Soil_Transect_3_2
[10] => Soil_Transect_2_2
[11] => Soil_Transect_1_2
[12] => SoilCO2_West_A_2
[13] => SoilCO2_West_B_2
[14] => SoilCO2_West_C_2
[15] => Tower_3
[16] => Soil_Transect_4_3
[17] => Soil_Transect_3_3
[18] => Soil_Transect_2_3
[19] => Soil_Transect_1_3
[20] => SoilCO2_West_A_3
[21] => SoilCO2_West_B_3
[22] => SoilCO2_West_C_3
[23] => Tower_4
[24] => Soil_Transect_4_4
[25] => Soil_Transect_3_4
[26] => Soil_Transect_2_4
[27] => Soil_Transect_1_4
[28] => SoilCO2_West_A_4
[29] => SoilCO2_West_B_4
[30] => SoilCO2_West_C_4
[31] => Soil_Transect_4_1
)
| Date | DOY | Rep | Depth | Tower_1 |
Soil_Transect_3_1 |
Soil_Transect_2_1 |
Soil_Transect_1_1 |
SoilCO2_West_A_1 |
SoilCO2_West_B_1 |
SoilCO2_West_C_1 |
Tower_2 |
Soil_Transect_4_2 |
Soil_Transect_3_2 |
Soil_Transect_2_2 |
Soil_Transect_1_2 |
SoilCO2_West_A_2 |
SoilCO2_West_B_2 |
SoilCO2_West_C_2 |
Tower_3 |
Soil_Transect_4_3 |
Soil_Transect_3_3 |
Soil_Transect_2_3 |
Soil_Transect_1_3 |
SoilCO2_West_A_3 |
SoilCO2_West_B_3 |
SoilCO2_West_C_3 |
Tower_4 |
Soil_Transect_4_4 |
Soil_Transect_3_4 |
Soil_Transect_2_4 |
Soil_Transect_1_4 |
SoilCO2_West_A_4 |
SoilCO2_West_B_4 |
SoilCO2_West_C_4 |
Soil_Transect_4_1 |
Avg | Spacial Count |
Measurement Count |
|---|---|---|---|---|---|---|---|---|---|---|---|---|---|---|---|---|---|---|---|---|---|---|---|---|---|---|---|---|---|---|---|---|---|---|---|---|---|---|
| 2021-10-26 | 299 | 0 | nan | 46.4 | 24.7 | 29.9 | 21.4 | 43.4 | 36.7 | 36.1 | 35 | 43.3 | 35.9 | 34.7 | 32.6 | 31.3 | 46.3 | 32.9 | 31.8 | 39.1 | 32.7 | 31.8 | 36.3 | 35.2 | 38 | 36.8 | 40 | 34.9 | 46 | 48.6 | 39.4 | 44 | 49.4 | 46.6 | ||||
| 2021-10-26 | 299 | 1 | nan | 46.1 | 24.1 | 29.4 | 21.7 | 43.7 | 37.3 | 35.8 | 35.6 | 43.3 | 35 | 34.7 | 32.6 | 31.6 | 46.9 | 34.4 | 31.5 | 39.1 | 32.4 | 32.4 | 36.8 | 35.4 | 36 | 36.3 | 42.3 | 35.4 | 45.1 | 48.3 | 39.7 | 44.3 | 48.3 | 48.8 | 20 | |||
| 2021-10-26 | 299 | Avg | 0-15cm | 0 | 0 | |||||||||||||||||||||||||||||||||
| 2021-10-26 | 299 | Avg | 15-30cm | 0 | 0 | |||||||||||||||||||||||||||||||||
| 2021-10-26 | 299 | Avg | 30-45cm | 0 | 0 | |||||||||||||||||||||||||||||||||
| 2021-10-26 | 299 | Avg | 45-60cm | 0 | 0 |
No VR Moisture Point data found
No TZ grass heigth found
No VR grass heigth found
No VR Tree DBH found
No water potential data found
No VR Grass Biomass data found
No VR OakLeaves Biomass data found
No VR PineNeedles Biomass data found
2 photos found

20211026VR_PondOverflow.jpg ( 2021-10-26 16:18:50 ) Full size: 1440x1920
The pond is full to overflowing

20211026VR_SpringInCA.jpg ( 2021-10-26 15:09:01 ) Full size: 1920x1440
Spring in California
9 sets found
16 VR_met graphs found
2 VR_flux graphs found
2 VR_soilco2 graphs found
2 VR_pond graphs found
Can't check TZVR_mixed
3 VR_fd graphs found
4 VR_processed graphs found
4 VR_arable graphs found
No data found for VR_soilvue.

