Field Notes
<--2021-10-26 15:00:00 | 2021-12-02 09:00:00-->Other sites visited today: Tonzi
Phenocam link: Searching...
Vaira: 2021-11-17 11:00:00 (DOY 321)
Author: Joe Verfaillie
Others:
Summary: Green grass, wet, removed FD west, Standard field work.
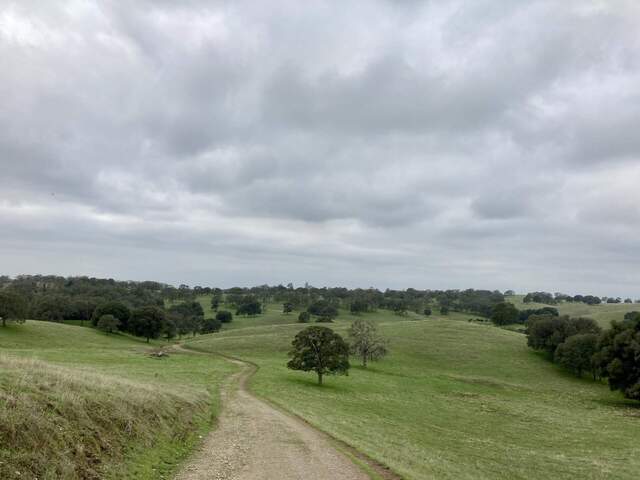
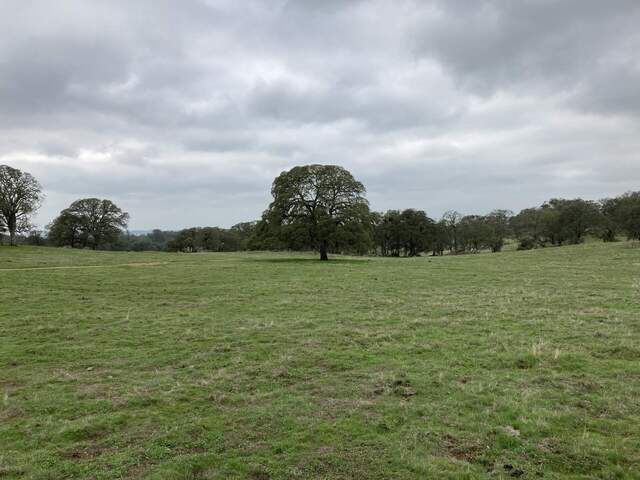
| Vaira 2021-11-17 I arrive at about 11:00 PST. Coming down from Sacramento there was a little mist on the windshield. Here it is mostly overcast and cool. The ground is wet, puddles on the road, the water hole is full and dew is on the grass. The fields are looking green with 2-5cm of new grass in the open areas and 15-20cm of grass in the protected areas. Mushrooms coming up here and there. Many of the trees still have green leaves. Looking back at photos from other years, the trees having leaves in not surprising but the grass looks greener probably mostly due to the lack of littler from the previous year. I said hello to a couple of cow ranchers on the way in. Looks like they were feeding hay to the cows. I measured the well level - it's come up a little. No functioning moisture point. I need to bring tools to pull out the three broken rods. I collected met, flux, camera images and FD data all seemed well. The 7500 read: 455.6ppm CO2, 502.5mmol/m3 H2O, 99.9kPa, 13.7C, 103.6SS I removed the West FD chamber sn FD20180068 - it's IRGA has been bad since before my last trip here. I left the stakes and metal rods in place. I put the cable connector in a plastic cap and taped it to one of the stakes to keep it dry. I checked the electric fence line and straightened it out in a couple of places. When I turned on the charger. The dial needle was stuck in the middle and it was clicking faster than usual. I turned it off again. I’ll see if any of the chargers in the lab are in working condition. I went to the pond. The water level has gone down a couple of feet since last time. I could hear running water where the dam is leaking into the stream. I left at about 12:10 PST |
Field Data
No tank data
Well Depth
| Date | Location | Depth (feet) |
|---|---|---|
| 2021-11-17 | VR_well | 58.25 |
| 2021-11-17 | VR_pond | 19.98 |
| 2021-11-17 | TZ_floor | 32.2 |
| 2021-11-17 | TZ_road | 39.9 |
mode = both
Moisture Point Probes TZ
Array
(
[0] => Tower_1
[1] => Soil_Transect_3_1
[2] => Soil_Transect_2_1
[3] => Soil_Transect_1_1
[4] => SoilCO2_West_A_1
[5] => SoilCO2_West_B_1
[6] => SoilCO2_West_C_1
[7] => Tower_2
[8] => Soil_Transect_4_2
[9] => Soil_Transect_3_2
[10] => Soil_Transect_2_2
[11] => Soil_Transect_1_2
[12] => SoilCO2_West_A_2
[13] => SoilCO2_West_B_2
[14] => SoilCO2_West_C_2
[15] => Tower_3
[16] => Soil_Transect_4_3
[17] => Soil_Transect_3_3
[18] => Soil_Transect_2_3
[19] => Soil_Transect_1_3
[20] => SoilCO2_West_A_3
[21] => SoilCO2_West_B_3
[22] => SoilCO2_West_C_3
[23] => Tower_4
[24] => Soil_Transect_4_4
[25] => Soil_Transect_3_4
[26] => Soil_Transect_2_4
[27] => Soil_Transect_1_4
[28] => SoilCO2_West_A_4
[29] => SoilCO2_West_B_4
[30] => SoilCO2_West_C_4
[31] => Soil_Transect_4_1
)
| Date | DOY | Rep | Depth | Tower_1 |
Soil_Transect_3_1 |
Soil_Transect_2_1 |
Soil_Transect_1_1 |
SoilCO2_West_A_1 |
SoilCO2_West_B_1 |
SoilCO2_West_C_1 |
Tower_2 |
Soil_Transect_4_2 |
Soil_Transect_3_2 |
Soil_Transect_2_2 |
Soil_Transect_1_2 |
SoilCO2_West_A_2 |
SoilCO2_West_B_2 |
SoilCO2_West_C_2 |
Tower_3 |
Soil_Transect_4_3 |
Soil_Transect_3_3 |
Soil_Transect_2_3 |
Soil_Transect_1_3 |
SoilCO2_West_A_3 |
SoilCO2_West_B_3 |
SoilCO2_West_C_3 |
Tower_4 |
Soil_Transect_4_4 |
Soil_Transect_3_4 |
Soil_Transect_2_4 |
Soil_Transect_1_4 |
SoilCO2_West_A_4 |
SoilCO2_West_B_4 |
SoilCO2_West_C_4 |
Soil_Transect_4_1 |
Avg | Spacial Count |
Measurement Count |
|---|---|---|---|---|---|---|---|---|---|---|---|---|---|---|---|---|---|---|---|---|---|---|---|---|---|---|---|---|---|---|---|---|---|---|---|---|---|---|
| 2021-11-17 | 321 | 0 | nan | 35.5 | 21.7 | 24.7 | 19.7 | 32.9 | 29.7 | 25.3 | 33.8 | 26.5 | 32.9 | 31 | 18.2 | 26.1 | 21 | 30.7 | 32.7 | 28.5 | 33.5 | 34.1 | 31.8 | 35.7 | 37.1 | 38.5 | 43.1 | 33.7 | 45.4 | 48.8 | 32.8 | 45.4 | 49.7 | 50.3 | ||||
| 2021-11-17 | 321 | 1 | nan | 32.9 | 22.3 | 24.1 | 20 | 33.2 | 29.4 | 25.8 | 33.8 | 26.1 | 32.9 | 30.7 | 18.8 | 25.5 | 21.6 | 30.1 | 33.8 | 28.8 | 33.5 | 34.6 | 31.8 | 35.7 | 36.8 | 37.4 | 41.7 | 35.1 | 45.1 | 49.1 | 33.4 | 45.7 | 51.7 | 49.1 | 24.1 | |||
| 2021-11-17 | 321 | Avg | 0-15cm | 0 | 0 | |||||||||||||||||||||||||||||||||
| 2021-11-17 | 321 | Avg | 15-30cm | 0 | 0 | |||||||||||||||||||||||||||||||||
| 2021-11-17 | 321 | Avg | 30-45cm | 0 | 0 | |||||||||||||||||||||||||||||||||
| 2021-11-17 | 321 | Avg | 45-60cm | 0 | 0 |
No VR Moisture Point data found
No TZ grass heigth found
No VR grass heigth found
No VR Tree DBH found
No water potential data found
No VR Grass Biomass data found
No VR OakLeaves Biomass data found
No VR PineNeedles Biomass data found
2 photos found

20211117VR_GrassTreesClouds.jpg ( 2021-11-17 12:06:54 ) Full size: 1920x1440
Overcast day with short green grass and dark green tree canopies

20211117VR_GreenGrass.jpg ( 2021-11-17 11:52:03 ) Full size: 1920x1440
The grass is looking good and the trees still have leaves.
9 sets found
16 VR_met graphs found
2 VR_flux graphs found
2 VR_soilco2 graphs found
2 VR_pond graphs found
Can't check TZVR_mixed
3 VR_fd graphs found
4 VR_processed graphs found
4 VR_arable graphs found
No data found for VR_soilvue.

