
Field Notes
<--2021-09-02 15:30:00 | 2021-09-09 08:20:00-->Other sites visited today: Hill Slough | Bouldin Corn | Bouldin Alfalfa | West Pond | East End
Phenocam link: Searching...
Gilbert Tract: 2021-09-03 15:40:00 (DOY 246)
Author: Daphne Szutu
Others: Carlos
Summary: Checking on tower after site setup, lots of ants
| 2021-09-03 Gilbert Tract Carlos and I arrived at 15:40 PDT. It was hot, humid, and hazy with not much breeze. There were tons of ants on all the cables going in and out of boxes. We left some mothballs in the datalogger and CR10x boxes. I downloaded met and USB data. I didn’t get the camera data today because I hadn’t cleared the card that we removed from SW yesterday before the move. I renamed the 7550 from SW-1569 to GT-1569 and reset the box. Carlos cleaned flux and rad sensors and topped off the reservoir. LI-7500 readings: CO2 26.2 umol/mol H2O 640pm T n/a (need new temperature dongle for 7550) P 101.1kPa SS 99--> 99 after cleaning LI7700 readings: CH4 2.0 RSSI 54--> 84 after cleaning We left at 16:05 PDT. |
4 photos found

20210902GT_InitialSetup.jpg ( 2021-09-02 18:35:35 ) Full size: 1920x801
After a long hard day the tower is up and running
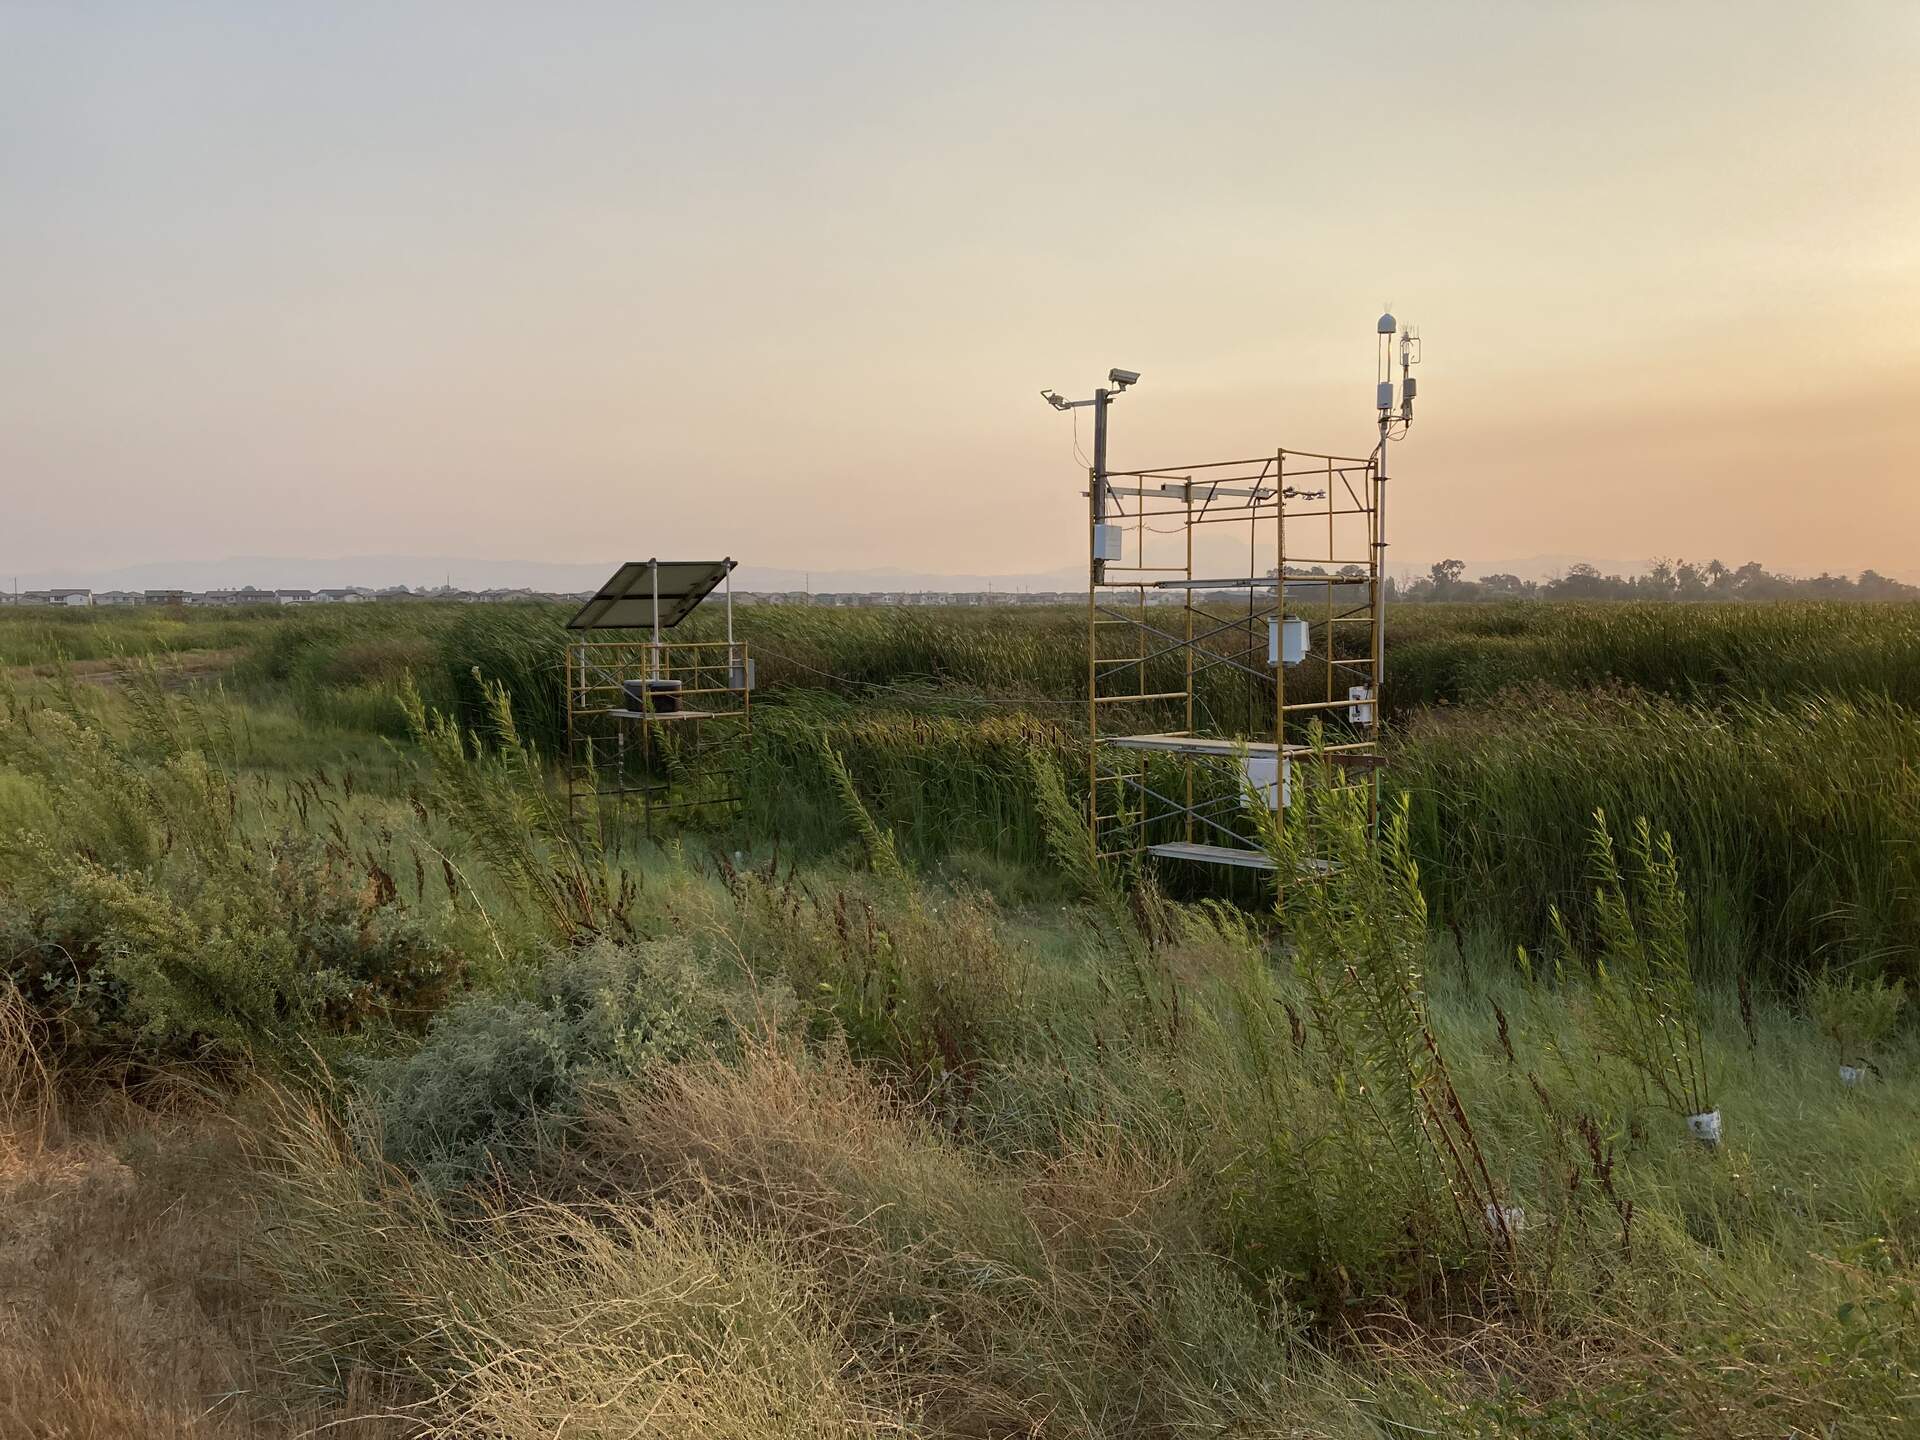
20210902GT_TowerAndPanels.jpg ( 2021-09-02 18:48:11 ) Full size: 1920x1440
View of the new Gilbert Tract site at Dutch Slough

20210904GT_FluxSensors.jpg ( 2021-09-03 15:54:03 ) Full size: 1920x1440
Dutch Slough flux sensors
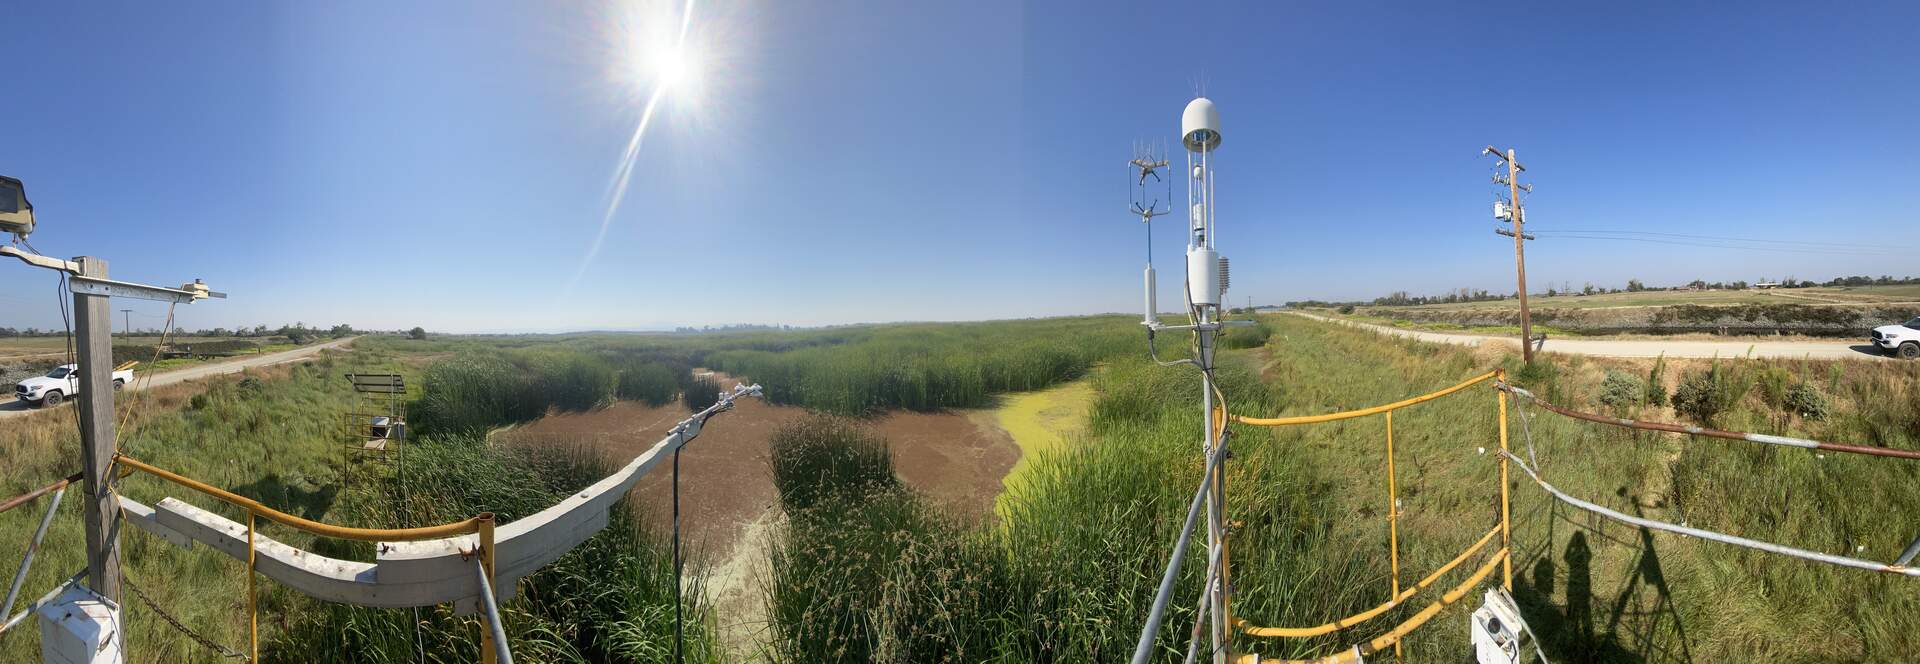
20210904GT_Tower.jpg ( 2021-09-03 15:54:23 ) Full size: 1920x664
Panoramic of Doutch Slough tower
8 sets found
Can't check MBWPEESWGT_mixed
Can't check MBEEWPSWEPGT_cam
16 GT_met graphs found
4 GT_flux graphs found
No data found for GT_adcp.
No data found for GT_cam.
2 GT_usgs graphs found
2 GT_chanexo graphs found