
Field Notes
<--2021-08-25 12:35:00 | 2021-09-15 13:30:00-->Other sites visited today: Gilbert Tract | Hill Slough | Bouldin Corn | West Pond | East End
Phenocam link: Searching...
Bouldin Alfalfa: 2021-09-03 11:00:00 (DOY 246)
Author: Daphne Szutu
Others: Carlos
Summary: Regular data collection/cleaning, swap out HMP45/ATMOS14 for brand-new HMP155 for advection experiment, veg height, spectral, changed eddy/camera clock +2min
| 2021-09-03 Bouldin Alfalfa Carlos and I arrived around 11:00 PDT. It was warm with a small breeze and super hazy skies—Mt. Diablo was pretty much invisible behind the haze. There were no bales on the field and the alfalfa is still between ankle and shin height. We stopped at the bouncer tower first to download data and to swap out the HMP45s for brand-new HMP155s. Next to the upper sonic, we removed HMP45 sn T1250012 and installed HMP155 sn T2820180. This sensor was wired to U9/10 on the datalogger. Next to the lower sonic, we removed HMP45 sn U3030041 and installed HMP155 sn T2820183, which was wired to U11/12. Both sensors are aspirated. I downloaded the bouncer data and uploaded a new datalogger program that has updated coefficients for the HMP155. AirT was around 23C and RH was around 50%. Carlos took veg height and spectral measurements near the bouncer tower. We got to the main tower around 12:30. I downloaded met, camera, and USB GHG data. AirT was around 26C and RH was around 43%. The met and camera data were ok, but the 10sec RH/T table on the CF card only had 1 line of data. The NL115 interface on the datalogger had an orange LED status light when I opened the datalogger box. I’m not sure why the card froze up. Carlos removed the ATMOS14 and installed a new HMP155 sn T2930114. This sensor has a brand-new radiation shield and aspirated with a 12V fan. I wired the new sensor to the mux and uploaded a new datalogger program that had updated coefficients for the HMP155. After sending the program, I inserted an empty CF card into the NL115 and checked that the card status was ok in the ‘Station Status’ tab and the status LED light was off. I changed the eddy and phenocam clocks +2min to match the laptop time and reset the 7550 box. I downloaded the FD data and cleared its memory. I also downloaded the fast IRT data as a TOB1 file, the 30-min data as a TOA5 file and deleted the source files. LI-7500 readings: CO2 300ppm H2O 700ppm T 26.4C P 101.3kPa SS 100--> 103 after cleaning LI7700 readings: CH4 2.0 RSSI 58--> 83 after cleaning We left at 13:20 PDT. |
Next Mowing: 2021-10-13
Veg Height (cm): Tape measure from ground to top of plant
36, 34, 34, 34, 30, 30, 27, 25, 24, 21, 20, 20, 17, 15, 14, avg = 25.4, stdev = 7.4
2 photos found
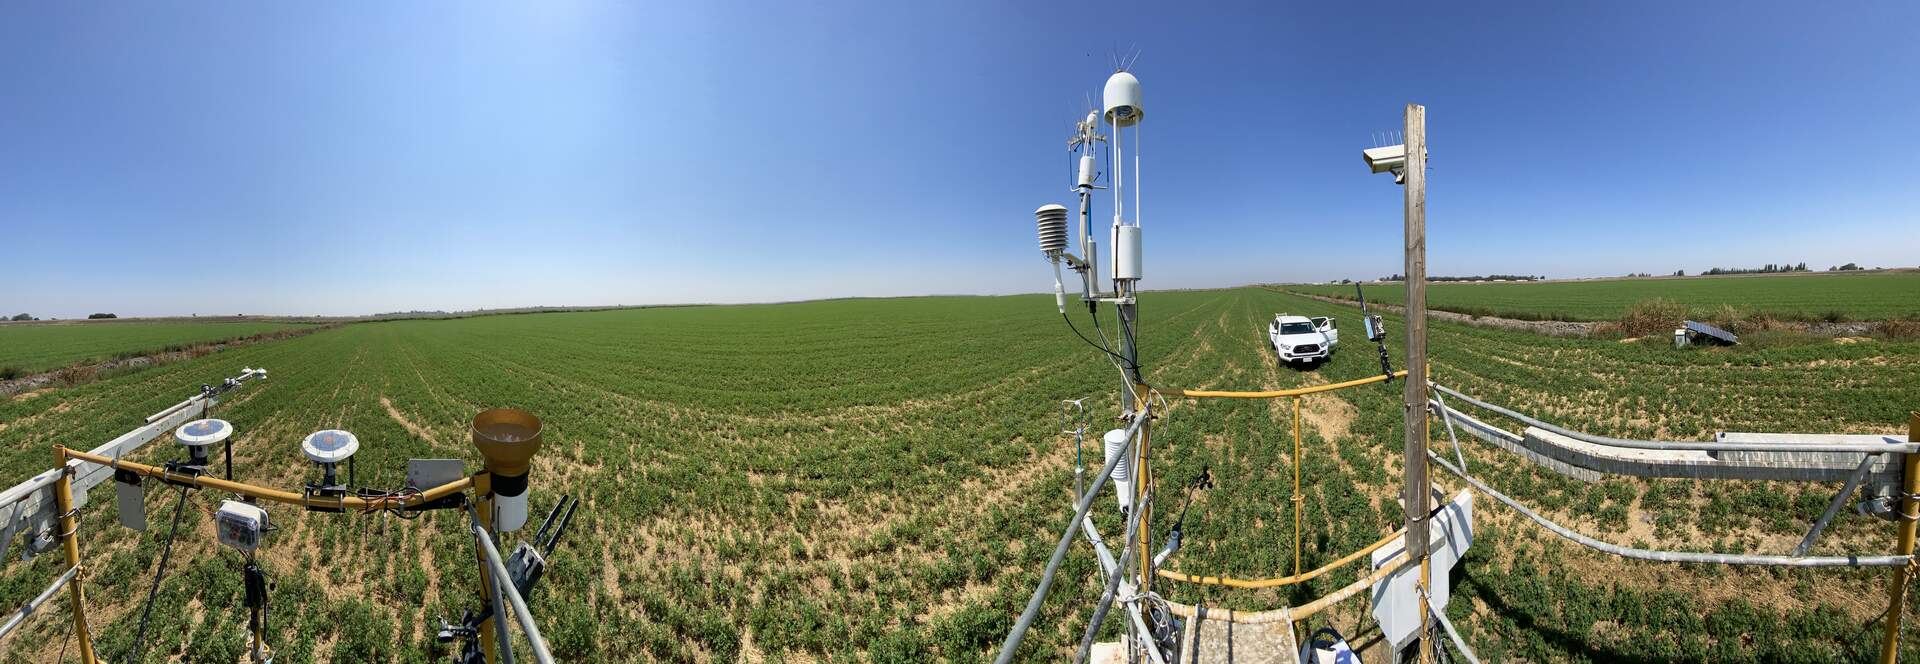
20210904BA_Tower.jpg ( 2021-09-03 13:20:30 ) Full size: 1920x664
Panoramic of BA tower
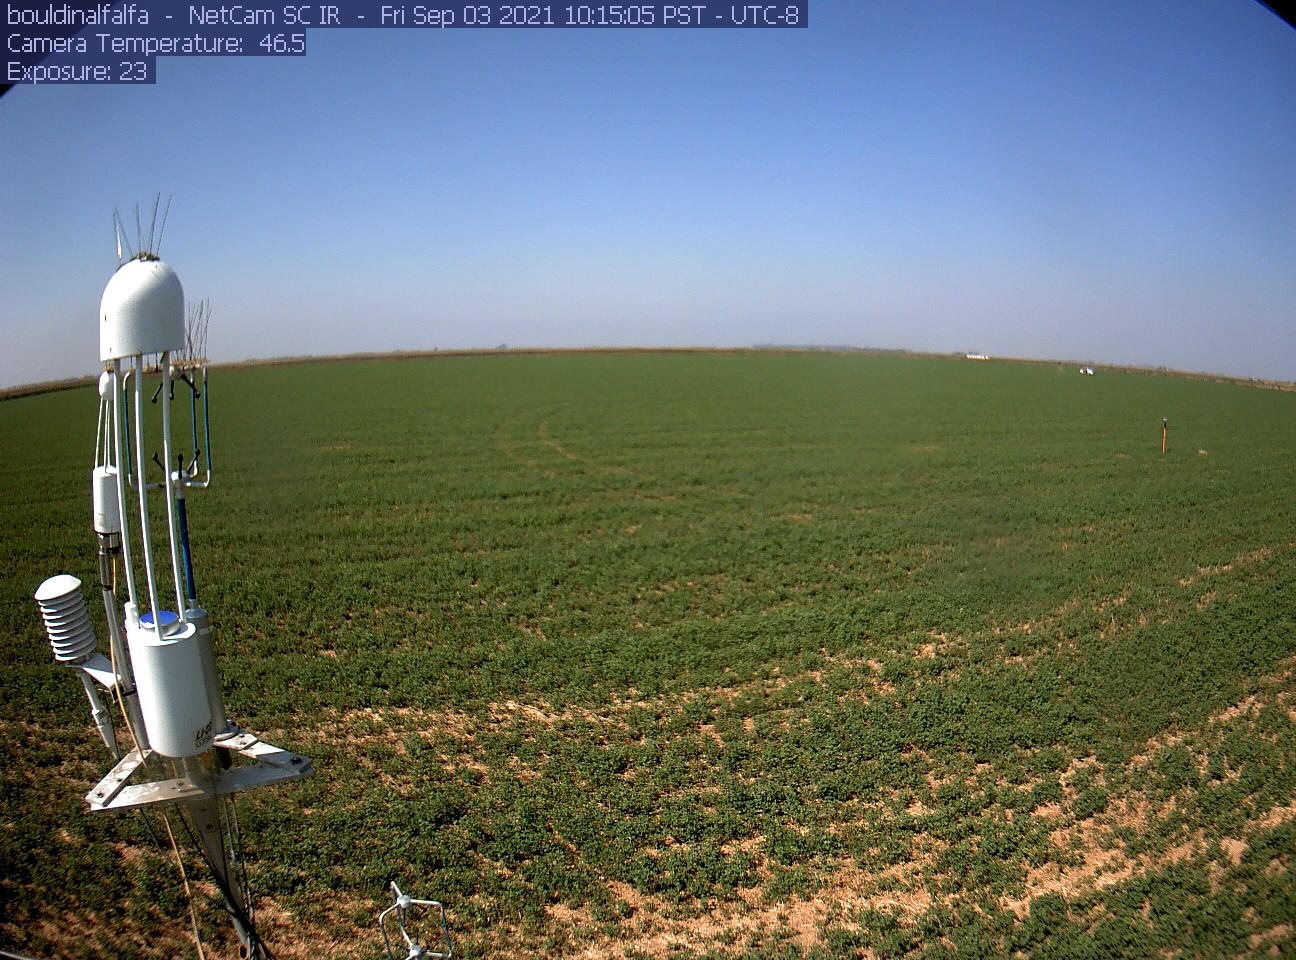
bouldinalfalfa_2021_09_03_101505.jpg ( 2021-09-03 10:18:12 ) Full size: 1296x960
Servicing Bouncer tower
7 sets found
5 BA_flux graphs found
21 BA_met graphs found
6 BA_arable graphs found
Can't check TATWBABCSB_cam
Can't check MBSWEEWPBCBA
2 BA_processed graphs found
No data found for BA_adex.