Field Notes

<--2021-07-21 08:20:00 | 2021-08-04 16:50:00-->
Other sites visited today: Bouldin Corn | Bouldin Alfalfa

Sherman Wetland: 2021-07-28 11:00:00 (DOY 209)
Author: Patty Oikawa
Others: Tobi, Julie, Maiyah, Isabel

Summary: Removed LGR laser

Arrived 11am with Tobi, Julie, Maiyah and Isabel
Hot day with light wind
Ran into Brian Brock; SI was very busy with Solano Land Trust vehicles and farmers/herders
Laser temps and adjustments looked fine
Turned off laser, didn’t have usb with us so I will turn it on back in the lab and download the data then
Removed all tubing from tower and laser and freezer/AC unit box. Turned off main power at telephone pole and removed all power lines and conduit.
Left at 2pm

1 photos found

Patty
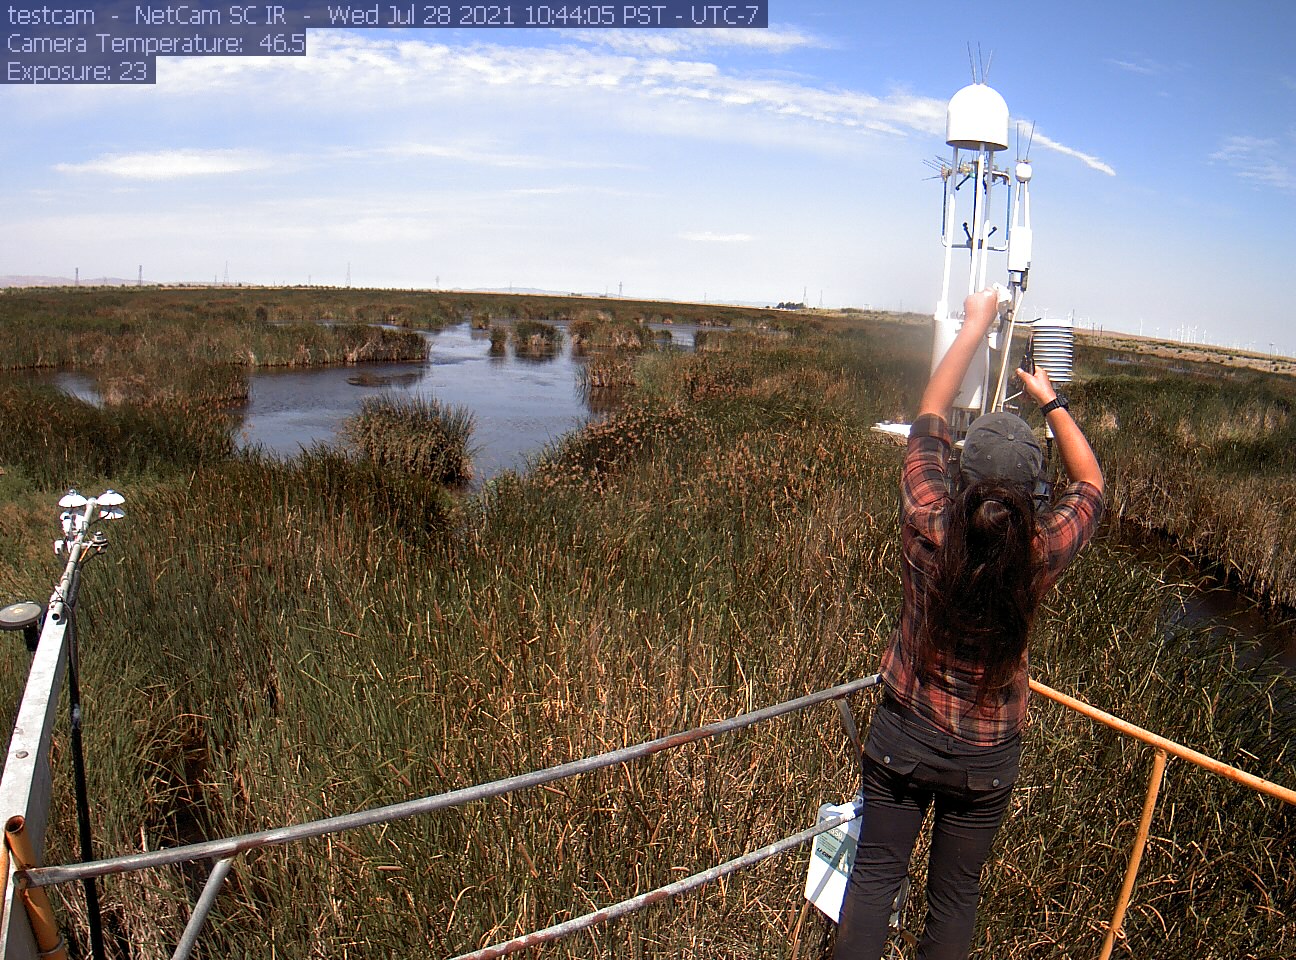
siwetland_2021_07_28_104405.jpg ( 2021-07-28 10:45:54 ) Full size: 1296x960
Patty's student removing equipment during LGR decomissioning

Graphs display:
7 sets found

Can't check MBWPEESWGT_mixed
Can't check MBEEWPSWEPGT_cam
16 SW_met graphs found

Explore the graph:Temperatures in a new window

Explore the graph:Water Temperature Profile A in a new window

Explore the graph:Water Temperature Profile B in a new window

Explore the graph:Soil Temperature Profile C2 in a new window

Explore the graph:Soil Heat Flux in a new window

Explore the graph:Four channel Radiometer in a new window

Explore the graph:Sherman Wetland PAR in a new window

Explore the graph:PRI Channels in a new window

Explore the graph:NDVI Channels in a new window

Explore the graph:Water level and Rain in a new window

Explore the graph:Dissolved CO2 in a new window

Explore the graph:Air Pressure in a new window

Explore the graph:Battery Voltage and RH in a new window

Explore the graph:Soil Temperature Profile C1 in a new window

Explore the graph:SRS NDVI and PRI in a new window

Explore the graph:SW miniDOT Dissolved Oxygen in a new window

4 SW_flux graphs found

Explore the graph:CO2 and H2O in a new window

Explore the graph:Wind in a new window

Explore the graph:Methane in a new window

Explore the graph:Data Counts in a new window

Can't check MBSWEEWPBCBA
Can't check SW_Temp
14 SW_Temp graphs found

Explore the graph:Temperatures in a new window

Explore the graph:CO2 and H2O in a new window

Explore the graph:Wind in a new window

Explore the graph:Methane in a new window

Explore the graph:Data Counts in a new window

Explore the graph:Temperature Profile A in a new window

Explore the graph:Temperature Profile B in a new window

Explore the graph:Temperature Profile C in a new window

Explore the graph:Soil Heat Flux in a new window

Explore the graph:Four-channel radiometer in a new window

Explore the graph:NDVI Channels in a new window

Explore the graph:PAR in a new window

Explore the graph:Air Pressure and Water Level in a new window

Explore the graph:Air T and RH in a new window

3 SW_arable graphs found

Explore the graph:Incoming Solar Bands in a new window

Explore the graph:Reflected Solar Bands in a new window

Explore the graph:Solar Radiation in a new window