Field Notes
<--2021-04-18 11:00:00 | 2021-05-19 11:40:00-->Other sites visited today: Sherman Wetland | Bouldin Alfalfa | Vaira
Phenocam link: Searching...
Tonzi: 2021-05-04 11:45:00 (DOY 124)
Author: Joe Verfaillie
Others: Sophie Ruehr
Summary: Show Sophie the site, standard data collection, reinstalled Floor well sensor and grass IRT, bolted down Road well data logger box. Very hot and dry.
| Tonzi 2021-05-04 I arrived at about 11:45 PDT. Sophie Ruehr had arrived a while before and was let through the gate by one of the residents. Today was hot and dry. The grass here is still mostly on the green side but going yellow fast. The trees look happy so far. There’s still a bunch of “teenage†cows hanging around causing trouble. I showed Sophie the site and how to do soil moisture, well level and swap the z-cam cards. She did a good job with those tasks. I collected all the data and read the dendrometers. I went to replace the Floor well water level sensor sn 1260403156 but the cows had again chewed the wire from the Floor tower to the junction box at the well. This time there was not enough slack left at the tower to replace the chewed portion but there was enough on the sensor that is usually spooled up inside the well to go the other direction. I moved the junction box away from the well by one length of conduit and made the connection there. I staked this piece of conduit down in three places – if the cows chew on the sensor cable it will be harder to replace than the extension wire they have chewed so far. The communication problems I was having with this sensor is because it uses red for data and white for power. I also replaced the grass IRT sensor sn 7385 at the Floor solar panels. This time the cal panel IRT was not reading because the green wire had come loose from SE channel 3. But it should all be working now as long as the cows don’t notice. At the Road well the cows continue to kick the data logger box around even though I buried it in rocks. This time I drilled a bolt into the concrete pad and bolted the plastic box to the pad. On the way out I took a length of rope away from a cow that was chewing on it – sheesh. We left for Vaira at about 15:00 PDT |
Field Data
No tank data
Well Depth
| Date | Location | Depth (feet) |
|---|---|---|
| 2021-05-04 | TZ_floor | 30.3 |
| 2021-05-04 | TZ_road | 38.4 |
| 2021-05-04 | TZ_tower | 34.45 |
| 2021-05-04 | VR_well | 56.4 |
mode = both
Moisture Point Probes TZ
Array
(
[0] => Tower_1
[1] => Soil_Transect_4_1
[2] => Soil_Transect_3_1
[3] => Soil_Transect_2_1
[4] => Soil_Transect_1_1
[5] => SoilCO2_West_A_1
[6] => SoilCO2_West_B_1
[7] => SoilCO2_West_C_1
[8] => Tower_2
[9] => Floor_South_2
[10] => Soil_Transect_4_2
[11] => Soil_Transect_3_2
[12] => Soil_Transect_2_2
[13] => Soil_Transect_1_2
[14] => SoilCO2_West_A_2
[15] => SoilCO2_West_B_2
[16] => SoilCO2_West_C_2
[17] => Tower_3
[18] => Floor_South_3
[19] => Soil_Transect_4_3
[20] => Soil_Transect_3_3
[21] => Soil_Transect_2_3
[22] => Soil_Transect_1_3
[23] => SoilCO2_West_A_3
[24] => SoilCO2_West_B_3
[25] => SoilCO2_West_C_3
[26] => Tower_4
[27] => Floor_South_4
[28] => Soil_Transect_4_4
[29] => Soil_Transect_3_4
[30] => Soil_Transect_2_4
[31] => Soil_Transect_1_4
[32] => SoilCO2_West_A_4
[33] => SoilCO2_West_B_4
[34] => SoilCO2_West_C_4
)
| Date | DOY | Rep | Depth | Tower_1 |
Soil_Transect_4_1 |
Soil_Transect_3_1 |
Soil_Transect_2_1 |
Soil_Transect_1_1 |
SoilCO2_West_A_1 |
SoilCO2_West_B_1 |
SoilCO2_West_C_1 |
Tower_2 |
Floor_South_2 |
Soil_Transect_4_2 |
Soil_Transect_3_2 |
Soil_Transect_2_2 |
Soil_Transect_1_2 |
SoilCO2_West_A_2 |
SoilCO2_West_B_2 |
SoilCO2_West_C_2 |
Tower_3 |
Floor_South_3 |
Soil_Transect_4_3 |
Soil_Transect_3_3 |
Soil_Transect_2_3 |
Soil_Transect_1_3 |
SoilCO2_West_A_3 |
SoilCO2_West_B_3 |
SoilCO2_West_C_3 |
Tower_4 |
Floor_South_4 |
Soil_Transect_4_4 |
Soil_Transect_3_4 |
Soil_Transect_2_4 |
Soil_Transect_1_4 |
SoilCO2_West_A_4 |
SoilCO2_West_B_4 |
SoilCO2_West_C_4 |
Avg | Spacial Count |
Measurement Count |
|---|---|---|---|---|---|---|---|---|---|---|---|---|---|---|---|---|---|---|---|---|---|---|---|---|---|---|---|---|---|---|---|---|---|---|---|---|---|---|---|---|---|
| 2021-05-04 | 124 | 0 | nan | 7.4 | 2.5 | 9.4 | 5.3 | 3 | 9.7 | 6.2 | 3.6 | 14.8 | 12.7 | 9.3 | 14.8 | 15.5 | 5.4 | 8.7 | 1.7 | 13.9 | 17.9 | 19.5 | 13.1 | 19.5 | 21.5 | 18.2 | 17.9 | 19.3 | 15.1 | 28.2 | 25.9 | 16.8 | 28.2 | 37.4 | 17.9 | 22.8 | 21.6 | 23.4 | |||
| 2021-05-04 | 124 | 1 | nan | 6.8 | 1.3 | 10.3 | 7.1 | 3.9 | 9.4 | 5.9 | 2.7 | 13.9 | 12.4 | 9 | 14.5 | 15.2 | 5.1 | 14.2 | 0.2 | 13.6 | 18.7 | 20.7 | 13.4 | 19.3 | 20.7 | 17.9 | 22.3 | 18.7 | 14.3 | 28.2 | 26.2 | 16.8 | 28.2 | 36.8 | 18.5 | 24.8 | 21.9 | 23.1 | |||
| 2021-05-04 | 124 | Avg | 0-15cm | 0 | 0 | ||||||||||||||||||||||||||||||||||||
| 2021-05-04 | 124 | Avg | 15-30cm | 0 | 0 | ||||||||||||||||||||||||||||||||||||
| 2021-05-04 | 124 | Avg | 30-45cm | 0 | 0 | ||||||||||||||||||||||||||||||||||||
| 2021-05-04 | 124 | Avg | 45-60cm | 0 | 0 |
mode = both
Moisture Point Probes VR
Array
(
[0] => Flux_Tower_1
[1] => Biomass_Cage_1
[2] => Flux_Tower_2
[3] => Biomass_Cage_2
[4] => Flux_Tower_3
[5] => Biomass_Cage_3
[6] => Flux_Tower_4
[7] => Biomass_Cage_4
)
| Date | DOY | Rep | Depth | Flux_Tower_1 |
Biomass_Cage_1 |
Flux_Tower_2 |
Biomass_Cage_2 |
Flux_Tower_3 |
Biomass_Cage_3 |
Flux_Tower_4 |
Biomass_Cage_4 |
Avg | Spacial Count |
Measurement Count |
|---|---|---|---|---|---|---|---|---|---|---|---|---|---|---|
| 2021-05-04 | 124 | 0 | nan | 1.2 | 0.3 | 9.3 | 5.4 | 4.54 | 12.9 | 12.5 | 15.3 | |||
| 2021-05-04 | 124 | 1 | nan | 1.5 | 0.3 | 9.7 | 4.8 | 4.8 | 12.3 | 13 | 14.8 | |||
| 2021-05-04 | 124 | Avg | 0-15cm | 0 | 0 | |||||||||
| 2021-05-04 | 124 | Avg | 15-30cm | 0 | 0 | |||||||||
| 2021-05-04 | 124 | Avg | 30-45cm | 0 | 0 | |||||||||
| 2021-05-04 | 124 | Avg | 45-60cm | 0 | 0 |
No TZ grass heigth found
Grass Height VR 16
| Date | Height reps (cm) | Location | Average | Samp | STDEV | |||||||||||||||
|---|---|---|---|---|---|---|---|---|---|---|---|---|---|---|---|---|---|---|---|---|
| 2021-05-04 | 19 | 23 | 21 | 10 | 14 | 31 | 28 | 31 | 20 | 36 | 26 | 27 | 60 | 38 | 20 | 10 | GH_ALL | 25.88 | 16 | 11.9 |
Tree DBH
| Date | Tag# | Reading (mm) |
|---|---|---|
| 2021-05-04 | 1 | 12.6 |
| 2021-05-04 | 102 | 8.1 |
| 2021-05-04 | 2 | 11.9 |
| 2021-05-04 | 245 | 13.7 |
| 2021-05-04 | 3 | 17.8 |
| 2021-05-04 | 4 | 11.9 |
| 2021-05-04 | 5 | 5.3 |
| 2021-05-04 | 6 | 17.1 |
| 2021-05-04 | 7 | 19.9 |
| 2021-05-04 | 72 | 12.4 |
| 2021-05-04 | 79 | 12.3 |
No water potential data found
No TZ Grass Biomass data found
No TZ OakLeaves Biomass data found
No TZ PineNeedles Biomass data found
2 photos found

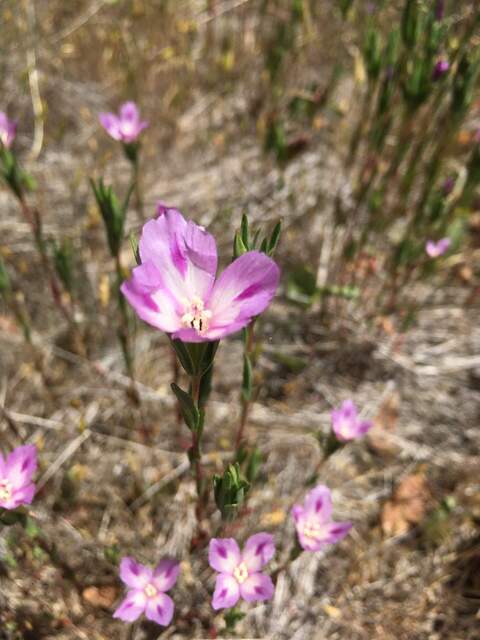
20210504TZ_Flowers.jpg ( 2021-05-04 12:56:18 ) Full size: 1440x1920
These flowers are more abundant this year

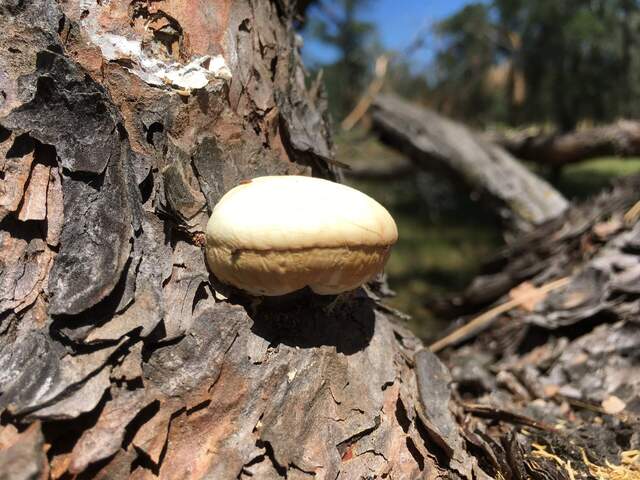
20210504TZ_Fungus.jpg ( 2021-05-04 13:43:09 ) Full size: 1920x1440
Fungus on a log agog
16 sets found
No data found for TZ_Fenergy.
11 TZ_tmet graphs found
11 TZ_soilco2 graphs found
Can't check TZ_mixed
3 TZ_mixed graphs found
1 TZ_fflux graphs found
8 TZ_fmet graphs found
No data found for TZ_tram.
3 TZ_co2prof graphs found
1 TZ_irt graphs found
No data found for TZ_windprof.
1 TZ_tflux graphs found
2 TZ_sm graphs found
Can't check TZ_met
1 TZ_met graphs found
Can't check TZVR_mixed
8 TZ_osu graphs found
3 TZ_fd graphs found
Tonzi Z-cam data

