
Field Notes
<--2021-03-17 09:20:00 | 2021-04-18 13:30:00-->Other sites visited today: West Pond | Bouldin Corn | Tonzi
Phenocam link: Searching...
Vaira: 2021-04-01 11:45:00 (DOY 91)
Author: Joe Verfaillie
Others:
Summary: Dry and warm. Trees half way through putting on leaves.
| Vaira 2021-04-01 I arrived at about 11:45 PDT. It was clear sunny and warm with a breeze from the west southwest that would come and go. All trees have some leaves but they are about in the middle of putting on leaves. The grass is beginning to grow too now about 7cm high in the grazed areas. Lots of white “popcorn†flowers inside the fence and on hill sides towards the pond – I did not go to the pond. The road was dry, not even damp in the usually wet places. I measured the well and the moisture point probes. I collected the flux, met, camera and FD chamber data. The 7500 read: 413.5ppm CO2, 390.3mmol/m3 H2O, 28.6C, 99.6kPa, 102.7SS The piece of Mylar shading the north FD chamber had come off I put it back on with electrical tape. The shade does seem to reduce the chamber’s temperature by 5-10C so I think it is worth making better quality versions. I checked the radiometers and cleaned the LW in. I did spectral measurements. I left at about 12:45 PDT |
Field Data
No tank data
Well Depth
| Date | Location | Depth (feet) |
|---|---|---|
| 2021-04-01 | VR_well | 56.2 |
| 2021-04-01 | TZ_road | 38.4 |
| 2021-04-01 | TZ_tower | 34.35 |
| 2021-04-01 | TZ_floor | 30.4 |
mode = both
Moisture Point Probes TZ
Array
(
[0] => Tower_1
[1] => Floor_South_1
[2] => Soil_Transect_4_1
[3] => Soil_Transect_3_1
[4] => Soil_Transect_2_1
[5] => Soil_Transect_1_1
[6] => SoilCO2_West_A_1
[7] => SoilCO2_West_B_1
[8] => SoilCO2_West_C_1
[9] => Tower_2
[10] => Floor_South_2
[11] => Soil_Transect_4_2
[12] => Soil_Transect_3_2
[13] => Soil_Transect_2_2
[14] => Soil_Transect_1_2
[15] => SoilCO2_West_A_2
[16] => SoilCO2_West_B_2
[17] => SoilCO2_West_C_2
[18] => Tower_3
[19] => Floor_South_3
[20] => Soil_Transect_4_3
[21] => Soil_Transect_3_3
[22] => Soil_Transect_2_3
[23] => Soil_Transect_1_3
[24] => SoilCO2_West_A_3
[25] => SoilCO2_West_B_3
[26] => SoilCO2_West_C_3
[27] => Tower_4
[28] => Floor_South_4
[29] => Soil_Transect_4_4
[30] => Soil_Transect_3_4
[31] => Soil_Transect_2_4
[32] => Soil_Transect_1_4
[33] => SoilCO2_West_A_4
[34] => SoilCO2_West_B_4
[35] => SoilCO2_West_C_4
)
| Date | DOY | Rep | Depth | Tower_1 |
Floor_South_1 |
Soil_Transect_4_1 |
Soil_Transect_3_1 |
Soil_Transect_2_1 |
Soil_Transect_1_1 |
SoilCO2_West_A_1 |
SoilCO2_West_B_1 |
SoilCO2_West_C_1 |
Tower_2 |
Floor_South_2 |
Soil_Transect_4_2 |
Soil_Transect_3_2 |
Soil_Transect_2_2 |
Soil_Transect_1_2 |
SoilCO2_West_A_2 |
SoilCO2_West_B_2 |
SoilCO2_West_C_2 |
Tower_3 |
Floor_South_3 |
Soil_Transect_4_3 |
Soil_Transect_3_3 |
Soil_Transect_2_3 |
Soil_Transect_1_3 |
SoilCO2_West_A_3 |
SoilCO2_West_B_3 |
SoilCO2_West_C_3 |
Tower_4 |
Floor_South_4 |
Soil_Transect_4_4 |
Soil_Transect_3_4 |
Soil_Transect_2_4 |
Soil_Transect_1_4 |
SoilCO2_West_A_4 |
SoilCO2_West_B_4 |
SoilCO2_West_C_4 |
Avg | Spacial Count |
Measurement Count |
|---|---|---|---|---|---|---|---|---|---|---|---|---|---|---|---|---|---|---|---|---|---|---|---|---|---|---|---|---|---|---|---|---|---|---|---|---|---|---|---|---|---|---|
| 2021-04-01 | 91 | 0 | nan | 30.5 | 13.2 | 38.9 | 17.3 | 17.9 | 13.2 | 16.2 | 19.4 | 15.9 | 31.3 | 31 | 22.8 | 27.4 | 29.2 | 15.2 | 33.2 | 14.8 | 27.7 | 31.8 | 41.6 | 26.2 | 29 | 33.8 | 32.1 | 41 | 22.3 | 36.3 | 43.1 | 50.3 | 30.8 | 40.3 | 48.6 | 33.4 | 26.2 | 58.3 | 49.4 | |||
| 2021-04-01 | 91 | 1 | nan | 30.8 | 13.8 | 39.9 | 17.6 | 17.3 | 13.5 | 15 | 19.1 | 16.5 | 31.3 | 31.3 | 23.7 | 27.1 | 29.2 | 16.1 | 33.8 | 14.8 | 27.4 | 32.7 | 41.3 | 25.7 | 28.5 | 33.5 | 31.5 | 41 | 31.5 | 36.8 | 42 | 52.3 | 30.5 | 41.7 | 51.7 | 33.7 | 26.8 | 51.4 | 50.3 | |||
| 2021-04-01 | 91 | Avg | 0-15cm | 0 | 0 | |||||||||||||||||||||||||||||||||||||
| 2021-04-01 | 91 | Avg | 15-30cm | 0 | 0 | |||||||||||||||||||||||||||||||||||||
| 2021-04-01 | 91 | Avg | 30-45cm | 0 | 0 | |||||||||||||||||||||||||||||||||||||
| 2021-04-01 | 91 | Avg | 45-60cm | 0 | 0 |
mode = both
Moisture Point Probes VR
Array
(
[0] => Flux_Tower_1
[1] => Biomass_Cage_1
[2] => Flux_Tower_2
[3] => Biomass_Cage_2
[4] => Flux_Tower_3
[5] => Biomass_Cage_3
[6] => Flux_Tower_4
[7] => Biomass_Cage_4
)
| Date | DOY | Rep | Depth | Flux_Tower_1 |
Biomass_Cage_1 |
Flux_Tower_2 |
Biomass_Cage_2 |
Flux_Tower_3 |
Biomass_Cage_3 |
Flux_Tower_4 |
Biomass_Cage_4 |
Avg | Spacial Count |
Measurement Count |
|---|---|---|---|---|---|---|---|---|---|---|---|---|---|---|
| 2021-04-01 | 91 | 0 | nan | 8 | 5.9 | 24 | 14.4 | 12.6 | 23.5 | 23.6 | 25.9 | |||
| 2021-04-01 | 91 | 1 | nan | 7.7 | 6.2 | 24 | 14.2 | 14 | 24 | 24.2 | 25.6 | |||
| 2021-04-01 | 91 | Avg | 0-15cm | 0 | 0 | |||||||||
| 2021-04-01 | 91 | Avg | 15-30cm | 0 | 0 | |||||||||
| 2021-04-01 | 91 | Avg | 30-45cm | 0 | 0 | |||||||||
| 2021-04-01 | 91 | Avg | 45-60cm | 0 | 0 |
No TZ grass heigth found
No VR grass heigth found
No VR Tree DBH found
No water potential data found
No VR Grass Biomass data found
No VR OakLeaves Biomass data found
No VR PineNeedles Biomass data found
1 photos found
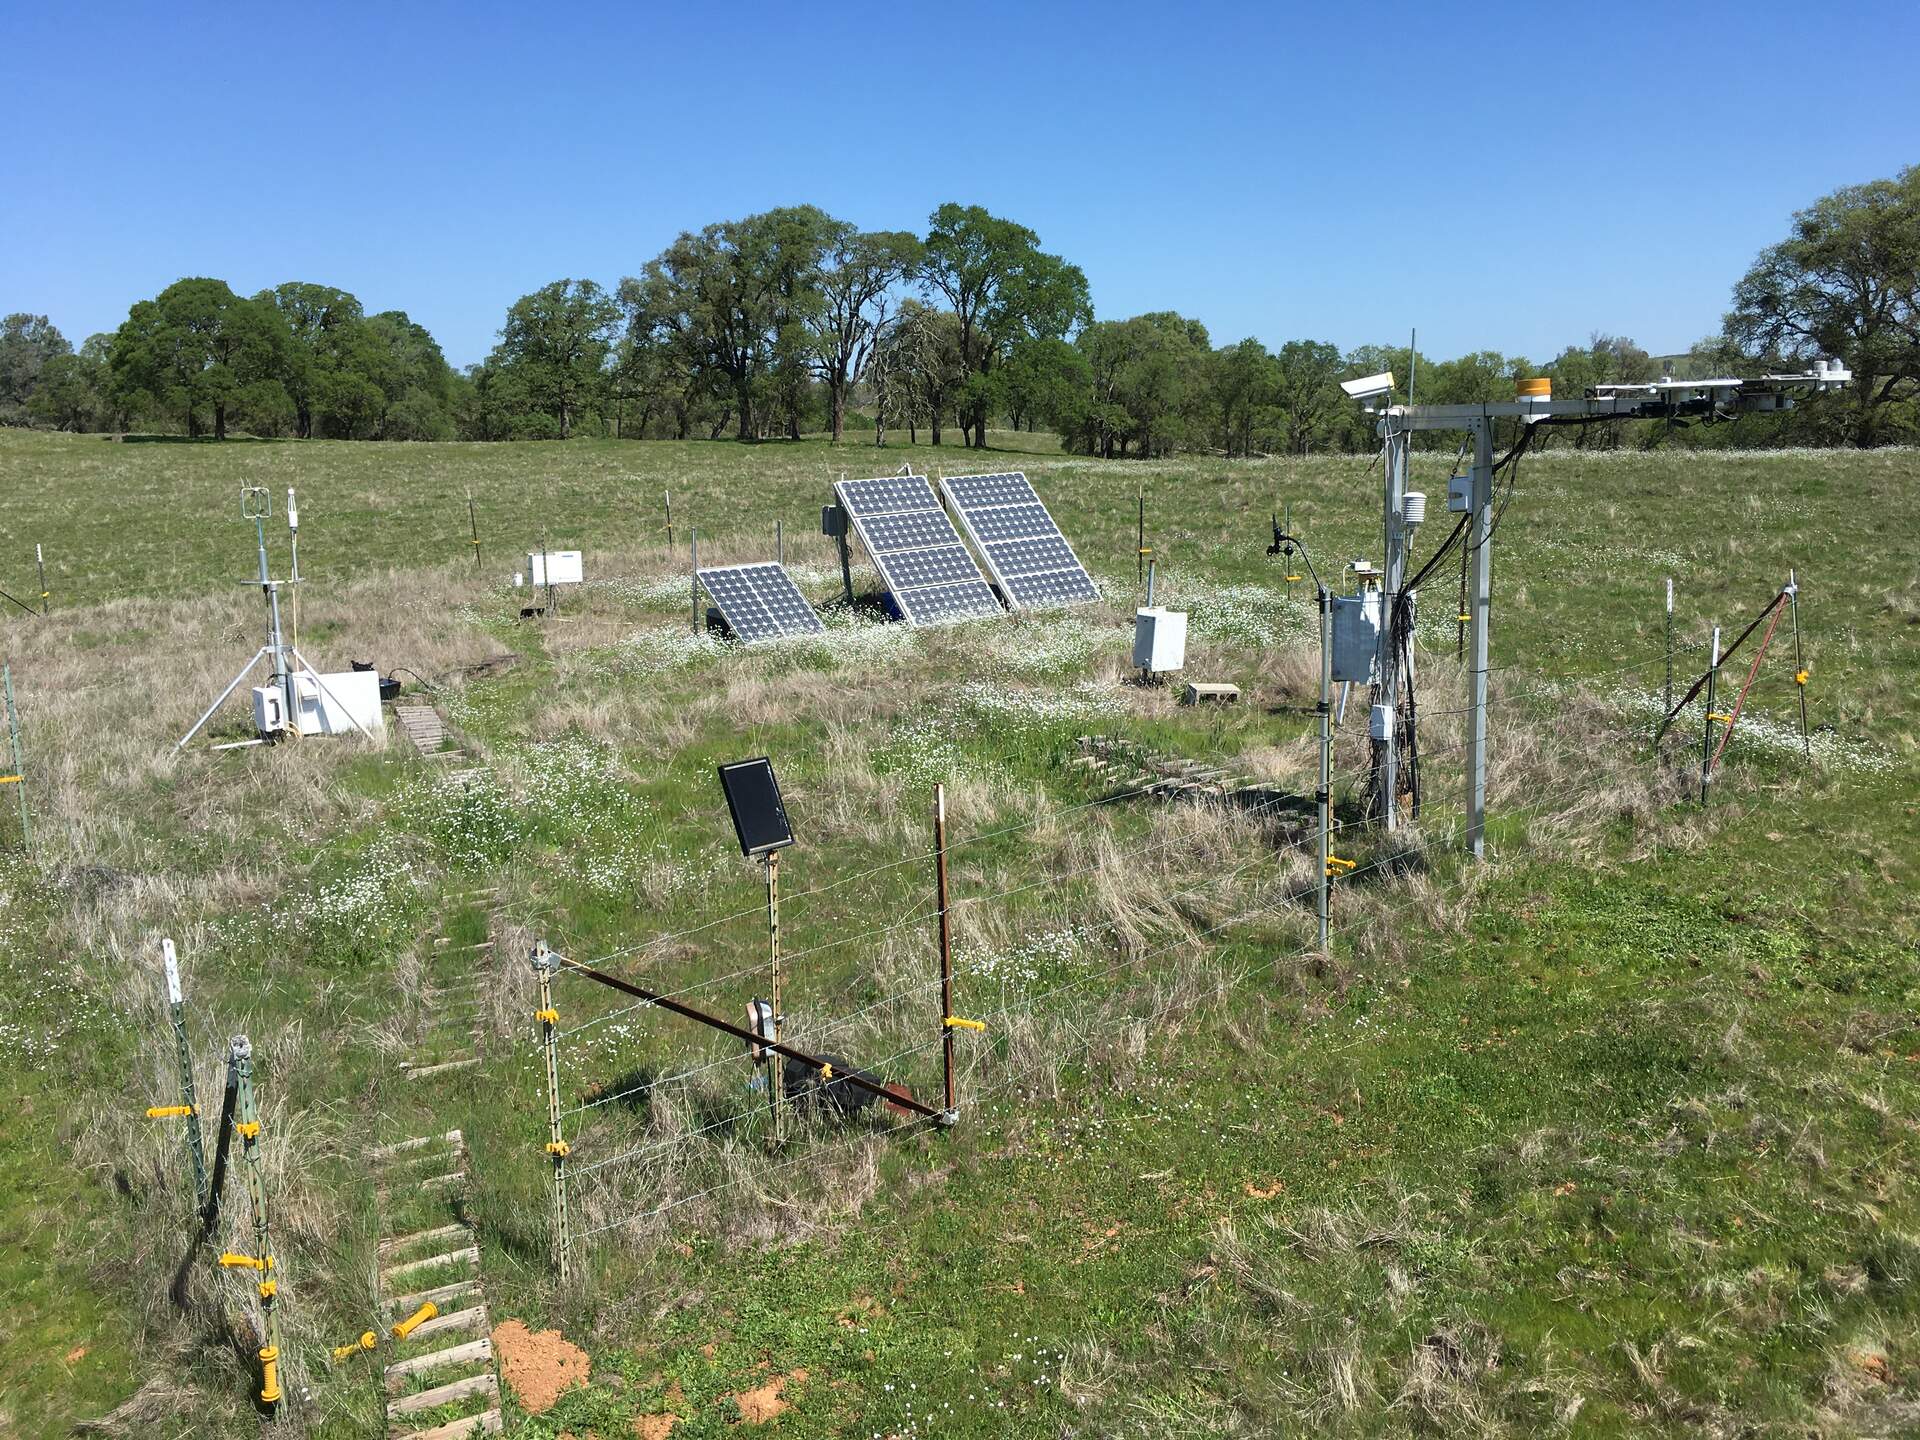
20210401VR_Flowers.jpg ( 2021-04-01 12:27:00 ) Full size: 1920x1440
Lots of white flowers
9 sets found
16 VR_met graphs found
2 VR_flux graphs found
2 VR_soilco2 graphs found
2 VR_pond graphs found
Can't check TZVR_mixed
3 VR_fd graphs found
4 VR_processed graphs found
4 VR_arable graphs found
No data found for VR_soilvue.