
Field Notes
<--2021-02-18 15:50:00 | 2021-03-11 09:00:00-->Other sites visited today: Sherman Wetland | Mayberry | East End | West Pond | Bouldin Corn
Phenocam link: Searching...
Bouldin Alfalfa: 2021-03-04 15:50:00 (DOY 63)
Author: Daphne Szutu
Others:
Summary: Regular data collection/cleaning, swapped 7500 for calibration, changed eddy clocks +3min, yellow spray droplets on field and equipment, AirT drifting low, camera card missing photos, alfalfa under tower/PL Arables lusher than the rest of the field
| 2021-03-04 Bouldin Alfalfa I arrived at 15:50 PST. It has now been a year since the start of COVID shelter-in-place orders. It was a mild and slightly breezy day with hazy horizons—I could barely make out Mt. Diablo on the horizon. No sheep seen on the fields or levees by us. The alfalfa is slightly fuller than at last visit, but it’s still much taller and lusher (~20-30cm tall) under and immediately around the tower and the PL Arables than it is in the rest of the field (~5-10cm). A yellow liquid has also been sprayed on the field. There were some yellow droplets on the plant leaves, on the radiation sensors, and on all the boxes. There was no obvious spray on the flux sensor lenses/mirrors. Maybe a pesticide before the alfalfa start growing in earnest. I downloaded met, camera, and USB GHG data. I downloaded FD data and cleared its memory. The wash reservoir was mostly full; I topped it off. I cleaned flux and rad sensors. The HMP AirT data has been drifting low in the past few weeks. The wiring looked ok and a power-cycle did not change anything. I checked the inside of the sensor and all looked ok, even the inside of the Teflon membrane looked smooth and clean. This sensor probably needs to be pulled and then replaced. The camera card only had a week of photos. This card is probably old and will be retired. I swapped LI-7500s for calibration: sn 75H-2182 came down and sn 75H-2669 went up. After the swap, I uploaded a new config file and updated the pressure coefficient. I also changed the eddy clocks from 16:17 to 16:20 to match the laptop time. I reset the 7550 box and checked that the USB was logging, the 7700 was connected, and the times still looked good. LI-7500 readings (sn 75H-2182 --> sn 75H-2182 after cleaning --> sn 75H-2669): CO2 421ppm --> 429 --> 420 H2O 394ppm --> 340 --> 338 T 21.9C --> 21.5 --> 19.5 P 102.3kPa --> 102.2 --> 102.3 SS 98--> 99 --> 101 LI7700 readings: CH4 2.1ppm RSSI 55-->72 after cleaning I left at 16:30 PST. |
Next Mowing: 2021-03-10
2 photos found
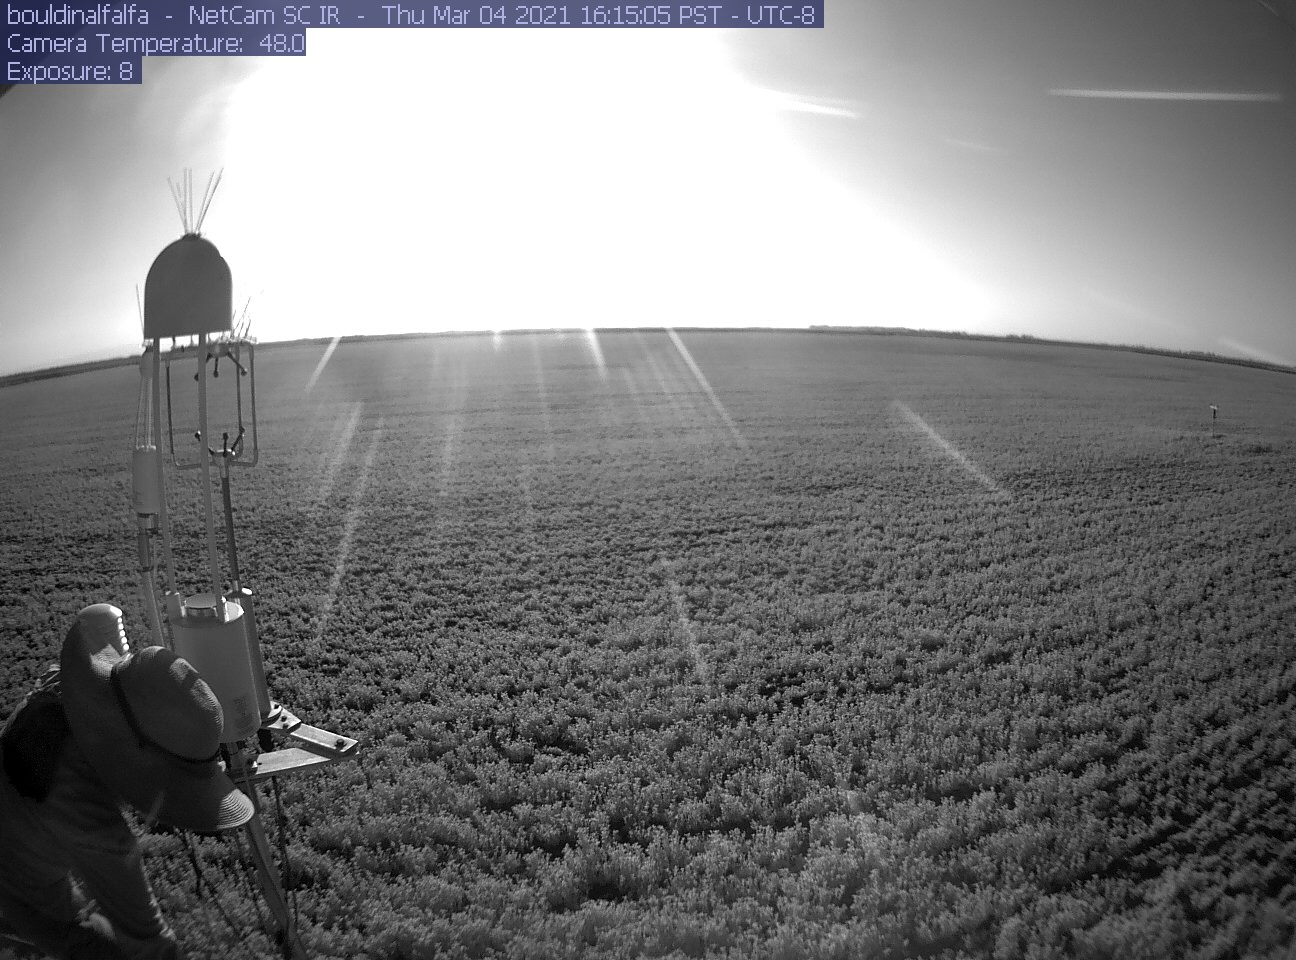
bouldinalfalfa_IR_2021_03_04_161505.jpg ( 2021-03-04 15:19:04 ) Full size: 1296x960
Daphne climbing
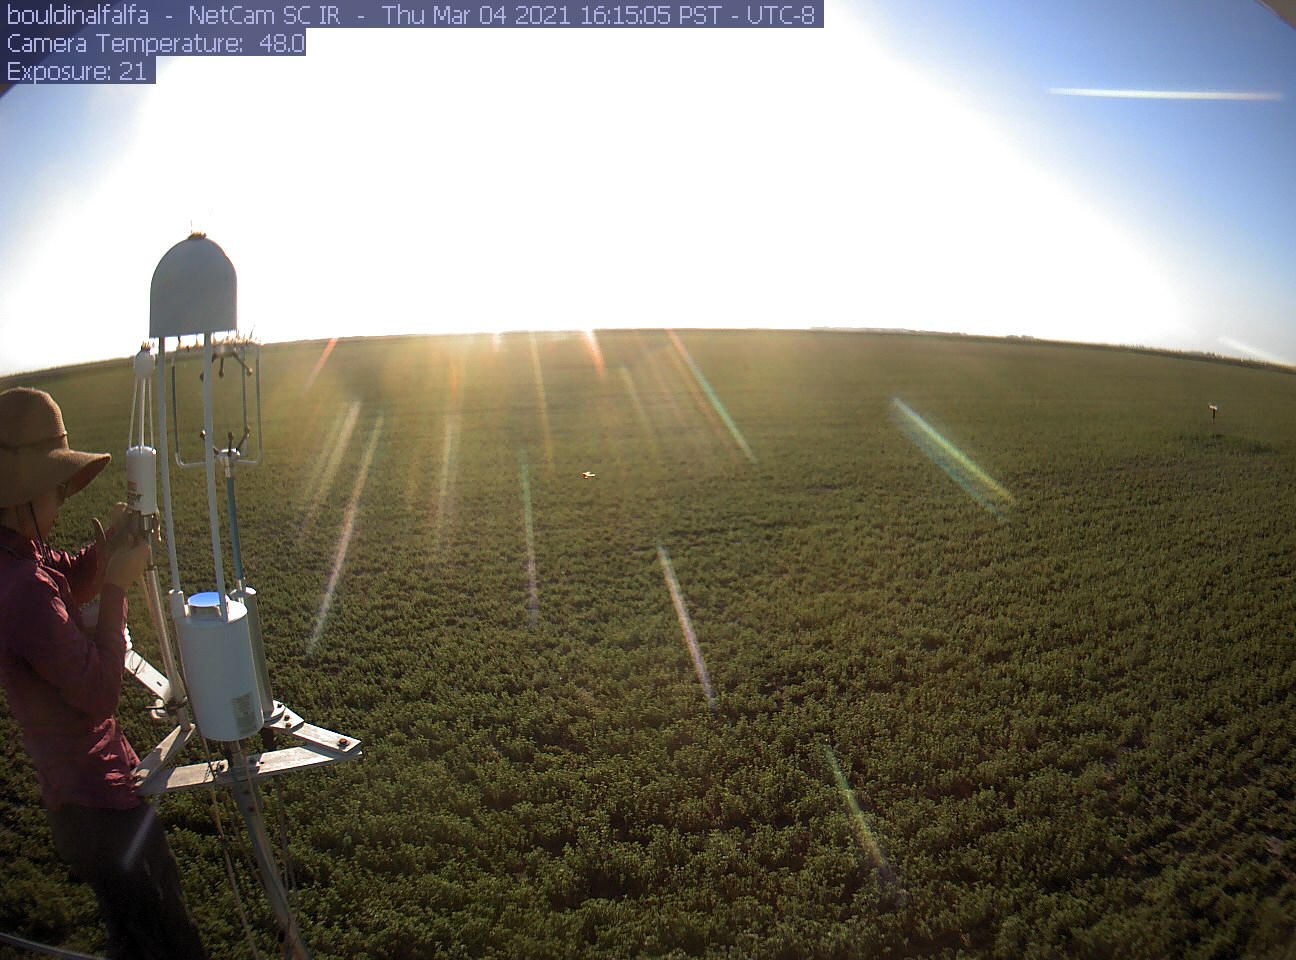
bouldinalfalfa_2021_03_04_161505.jpg ( 2021-03-04 15:18:22 ) Full size: 1296x960
Daphne swapping IRGAs
7 sets found
5 BA_flux graphs found
21 BA_met graphs found
6 BA_arable graphs found
Can't check TATWBABCSB_cam
Can't check MBSWEEWPBCBA
2 BA_processed graphs found
No data found for BA_adex.