Field Notes
<--2021-01-29 12:00:00 | 2021-02-04 13:20:00-->Other sites visited today: Hill Slough
Phenocam link: Searching...
Bouldin Corn: 2021-02-03 10:00:00 (DOY 34)
Author: Joe Verfaillie
Others: Daphne
Summary: Moved scaffolding back to power post, moved soil sensors, reinstalled all equipment removed last week, fresh eddy sensors. Tested tipping bucket
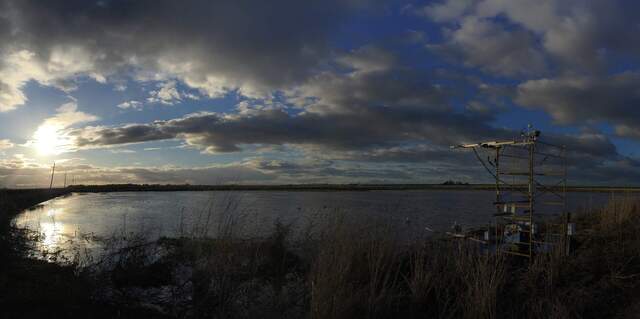
| Bouldin Corn 2021-02-03 Daphne and I arrived at 10:00. It was overcast with a light breeze in the morning becoming partly cloudy and windy in the afternoon. The afternoon felt colder than the morning but that might just have been the wind. The field is still heavily flooded. The water level might have gone down a bit and it is draining to the ditch to the south. We decided to move the tower back to the power pole and stake it down well. We will plan to make just the ground sensors and reflected radiation sensors mobile on a separate tripod. For now though we had to pull up the ground sensors to move the scaffolding and then we reinstalled the sensors at the edge of the field. We had enough slack in the cables to leave the well and FD Chamber in place. After moving the scaffolding we added back in the second layer of frames and moved the railings to the top. After leveling the scaffolding we staked it down with the traditional fence posts on the SE and NW corners. I added screw in anchors on the SW and NE corners. The ground is still very soft and all the anchors went in more easily than I would have liked. The grounding lug has broken off the bottom of the data logger box. We need replace it or come up with an alternate method of grounding. We added back a fresh set of eddy sensors and another 4-way net radiometer. The other sensors that survived and seem in good working order were also reinstalled. The pairs of PAR and SRS sensors were tested all facing up out the window of the lab. The PAR sensors matched very well but the SRS sensors were kind of all over the place – I think this is a result of their quality more than a result of getting dunked in the water and mud. We will need to see how well they match before and after the tower fell plus cross reference with the Arable data and BA. Sonic sn 153803 – 505cm agl, 338 true 7700 sn TG1-0224 – 496cm agl 7550 sn AIU-1866 7500 sn 1594 – 505cm agl CNR1 sn 990181 - Radiometers all about 436cm agl NDVI in sn 882103020 NDVI out sn 2046503357 PRI in sn 913003004 PRI out sn 897103002 PAR in sn 140453 PAR out sn 140441 Camera sn 0030f4d21491 - 416cm agl PurpleAir sn 68c63acc07a9 Arable Mark II sn C003251 Arable Mark II sn C006123 Davis wind set – 396cm agl Two Arable game cameras I had run all Licor equipment together and calibrated the 7500 in the lab. Daphne double checked the settings in the field. The 7500 read: 422ppm CO2, 370mmol/m3 H2O, 16.1C, 102.1kPa, 101.2SS The 7700 read: 1.97ppm CH4, 64RSSI We tested the tipping bucket with the new peristaltic pump at 3V. It seemed to run slower than in the lab taking 1hr 9min to run the 475ml through getting 113 tips. We did not adjust the bucket at this time. The power pole is still wobbly and needs to be replaced. We left at 16:45 |
1 photos found

20210203BC_Resurrection.jpg ( 2021-02-03 00:00:00 ) Full size: 1920x956
The tower has been restored after falling in last week’s storm
6 sets found
17 BC_met graphs found
5 BC_flux graphs found
Can't check TATWBABCSB_cam
Can't check MBSWEEWPBCBA
2 BC_pa graphs found
1 BC_arable graphs found

