
Field Notes
<--2020-07-28 11:00:00 | 2020-08-26 09:30:00-->Other sites visited today: Tonzi | Vaira | Bouldin Alfalfa
Phenocam link: Searching...
Tonzi: 2020-08-26 08:30:00 (DOY 239)
Author: Joe Verfaillie
Others: Siyan, Gerardo JPL
Summary: JPL swapped radiometers, swapped 7500, tower loosing power (smoke?), 80% leaves turned brown, swapped road well power pack, OSU SP1 chewed wires spliced, new water potential tank.
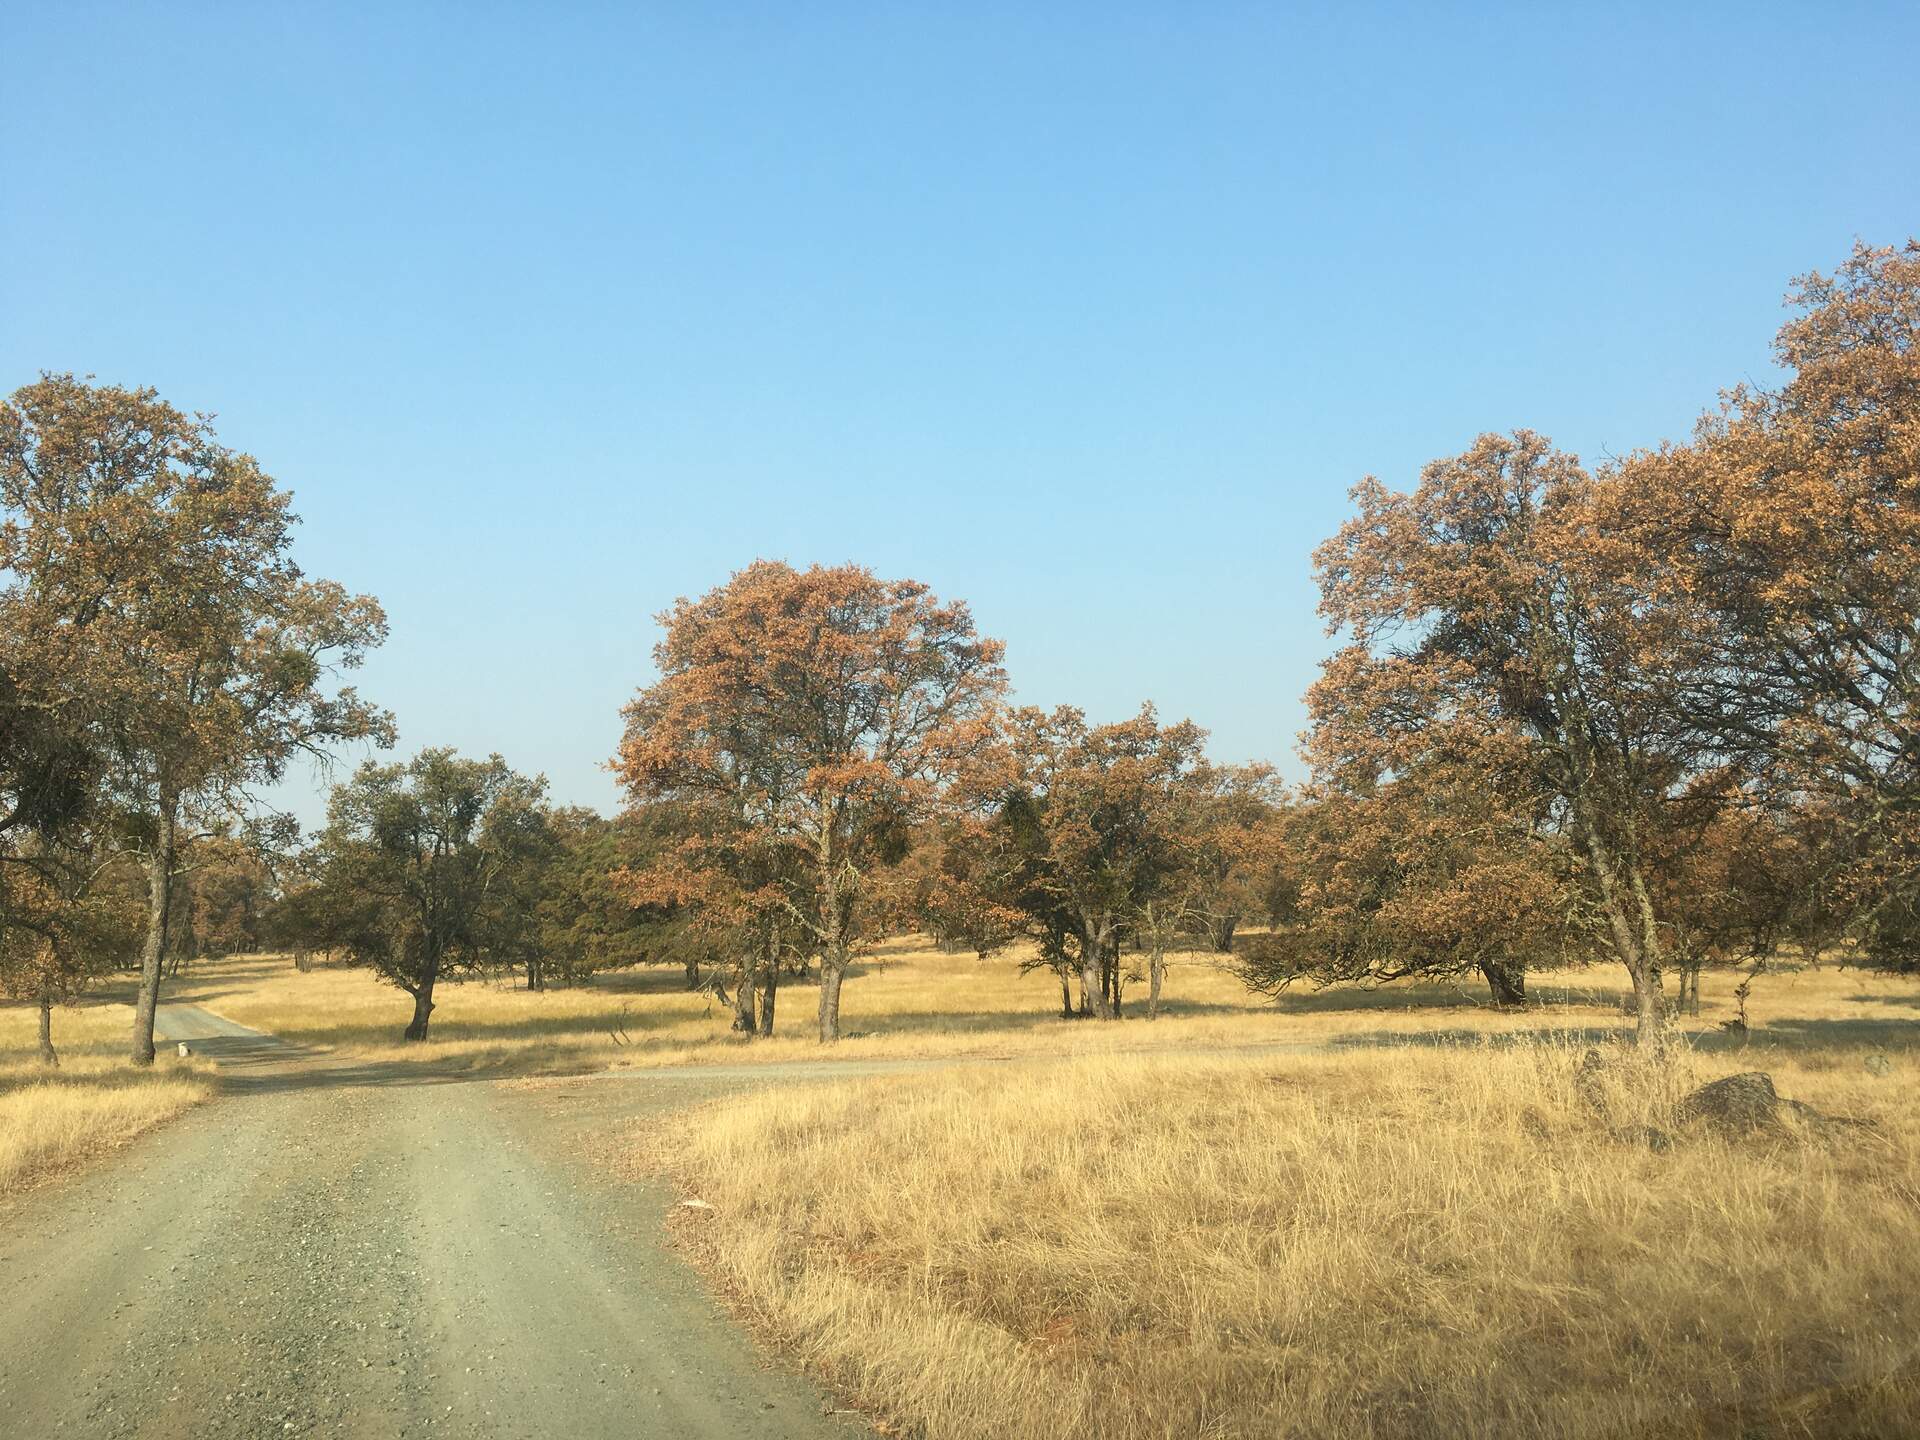
| Tonzi 2020-08-26 I arrived at about 8:30 PDT. Gerardo from JPL was there having arrived just before me. Siyan arrived later, about 10:30 after having visited Vaira. Maybe more than 80% of the trees have turned brown. A few individual trees still are mostly green (Liukang’s tree, the small tree with IRTs), some trees have a mixture of brown and green but most trees look completely brown. There is still some water in the pond but even trees near the pond are brown. The ground is very hard and dry. The dust is pockmarked from recent thunderstorms but it doesn’t look like much rain fell. Today was hazy. I could see Rancho Seco and there was only a hint of smoke in the air. Gerardo swapped out the radiometers that had quit on the tower and was on his way out in an hour or so. The 7500s were dirty from the rain. I swapped them out for calibration. On the Floor sn 75H-2514 came off and sn 0042 went on. On the Tower sn 75H-2180 came off and sn 0041 went on. Floor 2514: 417.4ppm CO2, 513.5mmol/m3 H2O, 98.6kPa, 28.1C, 100.9SS – after cleaning Floor 0042: 416.9ppm CO2, 506.5mmol/m3 H2O, 99.1kPa, 29.6C, 99.9SS Tower 2180: 380.3ppm CO2, 613.9mmol/m3 H2O, 98.5kPa, 27.7C, 96.2SS – before cleaning Tower 2180: 409.3ppm CO2, 491.0mmol/m3 H2O, 98.5kPa, 27.4C, 102.0SS – after cleaning Tower 0041: 416.6ppm CO2, 511.8mmol/m3 H2O, 98.4kPa, 28.6C, 101.0 The tower computer seemed okay. Some of the data logger files had not been updated but I was able to connect to the data loggers and update the files manually with no trouble. I had to reset the radio at the IRT CR1000 to get it to connect. The FLIR may have lost some images too but I was able to connect with it and its clock seemed to be correct. I didn’t notice that the last of the FLIR images were blurry. The phenocam’s clock got reset. I fixed it, but it is not clear if this was a one-time event or is happening each night when the camera is turned off. I need to be prepared to remove the relay next time if the clock get reset again. I collected the FD chamber data and cleared their memories. I noticed that some creature had chewed a couple of wires on the OSU SP1 system to pieces. One SHF and the PPT cable were shredded where they enter the box. I spliced them with some screw terminals for the time being. This looked like fox damage to me. The lithium power pack at the road well was drained. I knew it was low and brought a fresh one for the swap. I also removed an extra length of power wire when I put the new power pack in. I serviced the z-cams. All their clocks seemed good. I brought a new small tank of breathing air for Siyan to do midday water potential. I was pretty sure the fittings were the same but Siyan says they weren’t and that she was unable to do water potential. The tower has been losing power since the 20th. This coincides with the heavy smoke in the area and it is classic solar power failure just before sunrise. None of the other solar system are losing power and I don’t think the tower should be that close to the edge. I need to check to make sure something isn’t pulling unusual amounts of power. I left at about 11:30. |
Field Data
No tank data
Well Depth
| Date | Location | Depth (feet) |
|---|---|---|
| 2020-08-26 | VR_well | 58 |
| 2020-08-26 | TZ_floor | 29.8 |
| 2020-08-26 | TZ_tower | 34.3 |
| 2020-08-26 | TZ_road | 37.8 |
| 2020-08-26 | VR_pond | 14.56 |
mode = both
Moisture Point Probes TZ
Array
(
[0] => Tower_1
[1] => Floor_South_1
[2] => Floor_West_1
[3] => Soil_Transect_4_1
[4] => Soil_Transect_3_1
[5] => Soil_Transect_2_1
[6] => Soil_Transect_1_1
[7] => SoilCO2_West_A_1
[8] => SoilCO2_West_B_1
[9] => SoilCO2_West_C_1
[10] => Tower_2
[11] => Floor_South_2
[12] => Floor_West_2
[13] => Soil_Transect_4_2
[14] => Soil_Transect_3_2
[15] => Soil_Transect_2_2
[16] => Soil_Transect_1_2
[17] => SoilCO2_West_A_2
[18] => SoilCO2_West_B_2
[19] => SoilCO2_West_C_2
[20] => Tower_3
[21] => Floor_South_3
[22] => Soil_Transect_4_3
[23] => Soil_Transect_3_3
[24] => Soil_Transect_2_3
[25] => Soil_Transect_1_3
[26] => SoilCO2_West_A_3
[27] => SoilCO2_West_B_3
[28] => SoilCO2_West_C_3
[29] => Tower_4
[30] => Floor_South_4
[31] => Soil_Transect_4_4
[32] => Soil_Transect_3_4
[33] => Soil_Transect_2_4
[34] => Soil_Transect_1_4
[35] => SoilCO2_West_A_4
[36] => SoilCO2_West_B_4
[37] => SoilCO2_West_C_4
)
| Date | DOY | Rep | Depth | Tower_1 |
Floor_South_1 |
Floor_West_1 |
Soil_Transect_4_1 |
Soil_Transect_3_1 |
Soil_Transect_2_1 |
Soil_Transect_1_1 |
SoilCO2_West_A_1 |
SoilCO2_West_B_1 |
SoilCO2_West_C_1 |
Tower_2 |
Floor_South_2 |
Floor_West_2 |
Soil_Transect_4_2 |
Soil_Transect_3_2 |
Soil_Transect_2_2 |
Soil_Transect_1_2 |
SoilCO2_West_A_2 |
SoilCO2_West_B_2 |
SoilCO2_West_C_2 |
Tower_3 |
Floor_South_3 |
Soil_Transect_4_3 |
Soil_Transect_3_3 |
Soil_Transect_2_3 |
Soil_Transect_1_3 |
SoilCO2_West_A_3 |
SoilCO2_West_B_3 |
SoilCO2_West_C_3 |
Tower_4 |
Floor_South_4 |
Soil_Transect_4_4 |
Soil_Transect_3_4 |
Soil_Transect_2_4 |
Soil_Transect_1_4 |
SoilCO2_West_A_4 |
SoilCO2_West_B_4 |
SoilCO2_West_C_4 |
Avg | Spacial Count |
Measurement Count |
|---|---|---|---|---|---|---|---|---|---|---|---|---|---|---|---|---|---|---|---|---|---|---|---|---|---|---|---|---|---|---|---|---|---|---|---|---|---|---|---|---|---|---|---|---|
| 2020-08-26 | 239 | 0 | nan | 3.6 | 9.5 | 4.7 | 1.9 | 0.3 | 3 | 0.3 | 8.6 | 2.7 | 2.1 | 10.9 | 8.1 | 4.2 | 6 | 13.3 | 1.8 | 4.2 | 6.9 | 2.7 | 11.8 | 13.7 | 10.6 | 10.6 | 12 | 15.9 | 13.7 | 15.4 | 15.4 | 11.5 | 18.8 | 2.7 | 11 | 17 | 27.1 | 13.3 | 16.2 | 22.5 | 17.3 | |||
| 2020-08-26 | 239 | 1 | nan | 3.3 | 2.2 | 5 | 2.2 | 0.6 | 3.3 | 0.6 | 8.8 | 3.6 | 2.4 | 10.9 | 8.4 | 6.3 | 6 | 13.3 | 11.6 | 4.5 | 6 | 0.8 | 11.5 | 13.4 | 13.7 | 9.5 | 12.9 | 15.9 | 13.1 | 15.9 | 14.3 | 11.5 | 16.8 | 2.4 | 11 | 17.3 | 26.8 | 13 | 16.2 | 23.1 | 16.8 | |||
| 2020-08-26 | 239 | Avg | 0-15cm | 0 | 0 | |||||||||||||||||||||||||||||||||||||||
| 2020-08-26 | 239 | Avg | 15-30cm | 0 | 0 | |||||||||||||||||||||||||||||||||||||||
| 2020-08-26 | 239 | Avg | 30-45cm | 0 | 0 | |||||||||||||||||||||||||||||||||||||||
| 2020-08-26 | 239 | Avg | 45-60cm | 0 | 0 |
mode = both
Moisture Point Probes VR
Array
(
[0] => Flux_Tower_1
[1] => Biomass_Cage_1
[2] => Flux_Tower_2
[3] => Biomass_Cage_2
[4] => Flux_Tower_3
[5] => Biomass_Cage_3
[6] => Flux_Tower_4
[7] => Biomass_Cage_4
)
| Date | DOY | Rep | Depth | Flux_Tower_1 |
Biomass_Cage_1 |
Flux_Tower_2 |
Biomass_Cage_2 |
Flux_Tower_3 |
Biomass_Cage_3 |
Flux_Tower_4 |
Biomass_Cage_4 |
Avg | Spacial Count |
Measurement Count |
|---|---|---|---|---|---|---|---|---|---|---|---|---|---|---|
| 2020-08-26 | 239 | 0 | nan | 0.4 | 0.1 | 7.5 | 3.9 | 4.5 | 14 | 14.5 | 17 | |||
| 2020-08-26 | 239 | 1 | nan | 0.4 | 0.4 | 7.5 | 3.5 | 3.9 | 13.7 | 13.6 | 17.3 | |||
| 2020-08-26 | 239 | Avg | 0-15cm | 0 | 0 | |||||||||
| 2020-08-26 | 239 | Avg | 15-30cm | 0 | 0 | |||||||||
| 2020-08-26 | 239 | Avg | 30-45cm | 0 | 0 | |||||||||
| 2020-08-26 | 239 | Avg | 45-60cm | 0 | 0 |
No TZ grass heigth found
No VR grass heigth found
Tree DBH
| Date | Tag# | Reading (mm) |
|---|---|---|
| 2020-08-26 | 1 | 25.0 |
| 2020-08-26 | 102 | 2.9 |
| 2020-08-26 | 2 | 22.8 |
| 2020-08-26 | 245 | 11.5 |
| 2020-08-26 | 3 | 15.2 |
| 2020-08-26 | 4 | 8.9 |
| 2020-08-26 | 5 | 15.9 |
| 2020-08-26 | 7 | 19.1 |
| 2020-08-26 | 72 | 9.5 |
| 2020-08-26 | 79 | 19.9 |
No water potential data found
No TZ Grass Biomass data found
No TZ OakLeaves Biomass data found
No TZ PineNeedles Biomass data found
2 photos found
20200826TZ_DeadLeaves.jpg ( 2020-08-26 00:00:00 ) Full size: 1920x1440
Most of the trees have turned brown

IMG_2793.jpg ( 2020-08-26 11:03:34 ) Full size: 1920x925
Lots of dead leaves on the trees
16 sets found
No data found for TZ_Fenergy.
11 TZ_tmet graphs found
11 TZ_soilco2 graphs found
Can't check TZ_mixed
3 TZ_mixed graphs found
1 TZ_fflux graphs found
8 TZ_fmet graphs found
No data found for TZ_tram.
3 TZ_co2prof graphs found
1 TZ_irt graphs found
No data found for TZ_windprof.
1 TZ_tflux graphs found
2 TZ_sm graphs found
Can't check TZ_met
1 TZ_met graphs found
Can't check TZVR_mixed
8 TZ_osu graphs found
3 TZ_fd graphs found
Tonzi Z-cam data