
Field Notes
<--2020-08-26 08:30:00 | 2020-09-01 11:30:00-->Other sites visited today: Tonzi | Vaira | Bouldin Alfalfa
Phenocam link: Searching...
Tonzi: 2020-08-26 09:30:00 (DOY 239)
Author: Siyan Ma
Others: Joe, Gerardo JPL
Summary: Standard field work, 80% trees brown - super early, missed midday water potential due to tank issues
|
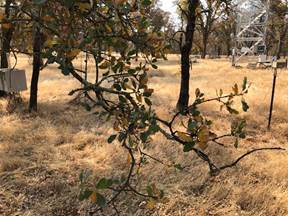
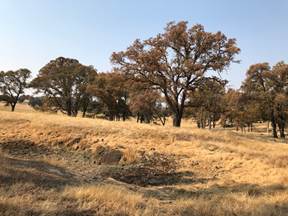
When: Date: 8/26/2020 , Day: 239 , Watch Time: 9:30 am . Where: Tonzi/Vaira Ranch Who: Siyan, Joe Weather: clear, sunny, smoke from wildfire Phenology: 80% of Oak leaves are brown; the earliest date of senescence since site established; almost all leaves of individual trees are torched; may check heat wave last week
Summary
5. Joe put a new tank (pressed air) at Tonzi for leaf water potential; the connection head size not matched; reported to Joe for a double check Vaira_Grass Site
Tonzi_Tower Site
3. closed gate and no electronic fence on. Toniz_Floor Site
|
Field Data
No tank data
Well Depth
| Date | Location | Depth (feet) |
|---|---|---|
| 2020-08-26 | VR_well | 58 |
| 2020-08-26 | TZ_floor | 29.8 |
| 2020-08-26 | TZ_tower | 34.3 |
| 2020-08-26 | TZ_road | 37.8 |
| 2020-08-26 | VR_pond | 14.56 |
mode = both
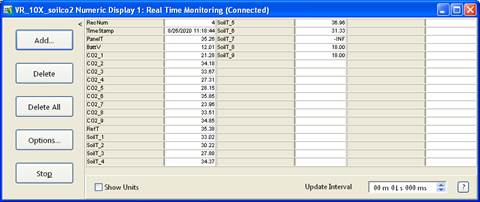
Moisture Point Probes TZ
Array
(
[0] => Tower_1
[1] => Floor_South_1
[2] => Floor_West_1
[3] => Soil_Transect_4_1
[4] => Soil_Transect_3_1
[5] => Soil_Transect_2_1
[6] => Soil_Transect_1_1
[7] => SoilCO2_West_A_1
[8] => SoilCO2_West_B_1
[9] => SoilCO2_West_C_1
[10] => Tower_2
[11] => Floor_South_2
[12] => Floor_West_2
[13] => Soil_Transect_4_2
[14] => Soil_Transect_3_2
[15] => Soil_Transect_2_2
[16] => Soil_Transect_1_2
[17] => SoilCO2_West_A_2
[18] => SoilCO2_West_B_2
[19] => SoilCO2_West_C_2
[20] => Tower_3
[21] => Floor_South_3
[22] => Soil_Transect_4_3
[23] => Soil_Transect_3_3
[24] => Soil_Transect_2_3
[25] => Soil_Transect_1_3
[26] => SoilCO2_West_A_3
[27] => SoilCO2_West_B_3
[28] => SoilCO2_West_C_3
[29] => Tower_4
[30] => Floor_South_4
[31] => Soil_Transect_4_4
[32] => Soil_Transect_3_4
[33] => Soil_Transect_2_4
[34] => Soil_Transect_1_4
[35] => SoilCO2_West_A_4
[36] => SoilCO2_West_B_4
[37] => SoilCO2_West_C_4
)
| Date | DOY | Rep | Depth | Tower_1 |
Floor_South_1 |
Floor_West_1 |
Soil_Transect_4_1 |
Soil_Transect_3_1 |
Soil_Transect_2_1 |
Soil_Transect_1_1 |
SoilCO2_West_A_1 |
SoilCO2_West_B_1 |
SoilCO2_West_C_1 |
Tower_2 |
Floor_South_2 |
Floor_West_2 |
Soil_Transect_4_2 |
Soil_Transect_3_2 |
Soil_Transect_2_2 |
Soil_Transect_1_2 |
SoilCO2_West_A_2 |
SoilCO2_West_B_2 |
SoilCO2_West_C_2 |
Tower_3 |
Floor_South_3 |
Soil_Transect_4_3 |
Soil_Transect_3_3 |
Soil_Transect_2_3 |
Soil_Transect_1_3 |
SoilCO2_West_A_3 |
SoilCO2_West_B_3 |
SoilCO2_West_C_3 |
Tower_4 |
Floor_South_4 |
Soil_Transect_4_4 |
Soil_Transect_3_4 |
Soil_Transect_2_4 |
Soil_Transect_1_4 |
SoilCO2_West_A_4 |
SoilCO2_West_B_4 |
SoilCO2_West_C_4 |
Avg | Spacial Count |
Measurement Count |
|---|---|---|---|---|---|---|---|---|---|---|---|---|---|---|---|---|---|---|---|---|---|---|---|---|---|---|---|---|---|---|---|---|---|---|---|---|---|---|---|---|---|---|---|---|
| 2020-08-26 | 239 | 0 | nan | 3.6 | 9.5 | 4.7 | 1.9 | 0.3 | 3 | 0.3 | 8.6 | 2.7 | 2.1 | 10.9 | 8.1 | 4.2 | 6 | 13.3 | 1.8 | 4.2 | 6.9 | 2.7 | 11.8 | 13.7 | 10.6 | 10.6 | 12 | 15.9 | 13.7 | 15.4 | 15.4 | 11.5 | 18.8 | 2.7 | 11 | 17 | 27.1 | 13.3 | 16.2 | 22.5 | 17.3 | |||
| 2020-08-26 | 239 | 1 | nan | 3.3 | 2.2 | 5 | 2.2 | 0.6 | 3.3 | 0.6 | 8.8 | 3.6 | 2.4 | 10.9 | 8.4 | 6.3 | 6 | 13.3 | 11.6 | 4.5 | 6 | 0.8 | 11.5 | 13.4 | 13.7 | 9.5 | 12.9 | 15.9 | 13.1 | 15.9 | 14.3 | 11.5 | 16.8 | 2.4 | 11 | 17.3 | 26.8 | 13 | 16.2 | 23.1 | 16.8 | |||
| 2020-08-26 | 239 | Avg | 0-15cm | 0 | 0 | |||||||||||||||||||||||||||||||||||||||
| 2020-08-26 | 239 | Avg | 15-30cm | 0 | 0 | |||||||||||||||||||||||||||||||||||||||
| 2020-08-26 | 239 | Avg | 30-45cm | 0 | 0 | |||||||||||||||||||||||||||||||||||||||
| 2020-08-26 | 239 | Avg | 45-60cm | 0 | 0 |
mode = both
Moisture Point Probes VR
Array
(
[0] => Flux_Tower_1
[1] => Biomass_Cage_1
[2] => Flux_Tower_2
[3] => Biomass_Cage_2
[4] => Flux_Tower_3
[5] => Biomass_Cage_3
[6] => Flux_Tower_4
[7] => Biomass_Cage_4
)
| Date | DOY | Rep | Depth | Flux_Tower_1 |
Biomass_Cage_1 |
Flux_Tower_2 |
Biomass_Cage_2 |
Flux_Tower_3 |
Biomass_Cage_3 |
Flux_Tower_4 |
Biomass_Cage_4 |
Avg | Spacial Count |
Measurement Count |
|---|---|---|---|---|---|---|---|---|---|---|---|---|---|---|
| 2020-08-26 | 239 | 0 | nan | 0.4 | 0.1 | 7.5 | 3.9 | 4.5 | 14 | 14.5 | 17 | |||
| 2020-08-26 | 239 | 1 | nan | 0.4 | 0.4 | 7.5 | 3.5 | 3.9 | 13.7 | 13.6 | 17.3 | |||
| 2020-08-26 | 239 | Avg | 0-15cm | 0 | 0 | |||||||||
| 2020-08-26 | 239 | Avg | 15-30cm | 0 | 0 | |||||||||
| 2020-08-26 | 239 | Avg | 30-45cm | 0 | 0 | |||||||||
| 2020-08-26 | 239 | Avg | 45-60cm | 0 | 0 |
No TZ grass heigth found
No VR grass heigth found
Tree DBH
| Date | Tag# | Reading (mm) |
|---|---|---|
| 2020-08-26 | 1 | 25.0 |
| 2020-08-26 | 102 | 2.9 |
| 2020-08-26 | 2 | 22.8 |
| 2020-08-26 | 245 | 11.5 |
| 2020-08-26 | 3 | 15.2 |
| 2020-08-26 | 4 | 8.9 |
| 2020-08-26 | 5 | 15.9 |
| 2020-08-26 | 7 | 19.1 |
| 2020-08-26 | 72 | 9.5 |
| 2020-08-26 | 79 | 19.9 |
No water potential data found
No TZ Grass Biomass data found
No TZ OakLeaves Biomass data found
No TZ PineNeedles Biomass data found
2 photos found
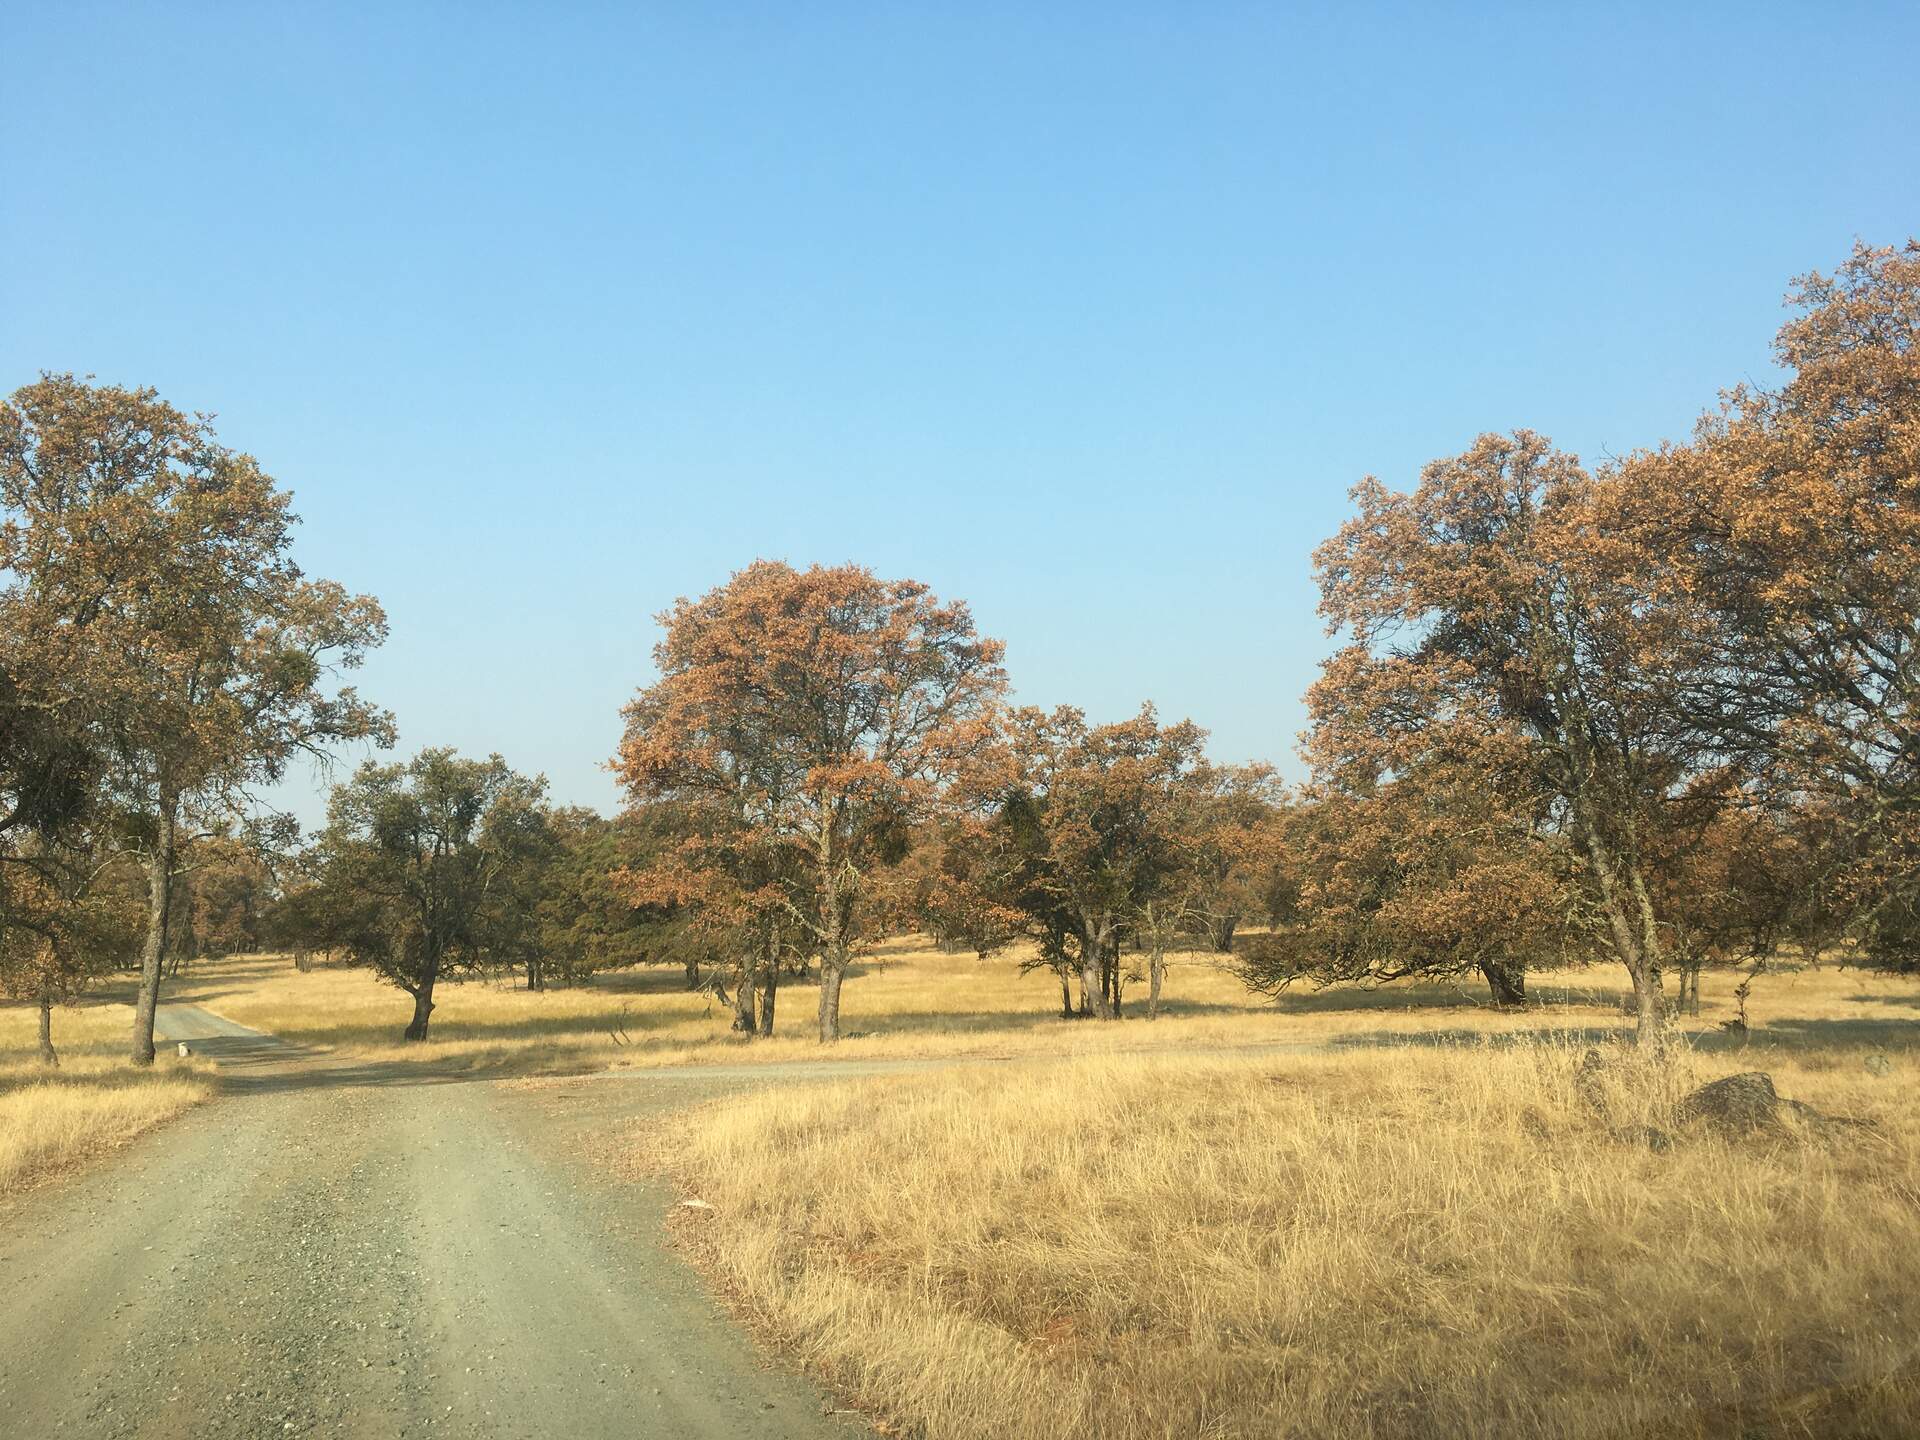
20200826TZ_DeadLeaves.jpg ( 2020-08-26 00:00:00 ) Full size: 1920x1440
Most of the trees have turned brown

IMG_2793.jpg ( 2020-08-26 11:03:34 ) Full size: 1920x925
Lots of dead leaves on the trees
16 sets found
No data found for TZ_Fenergy.
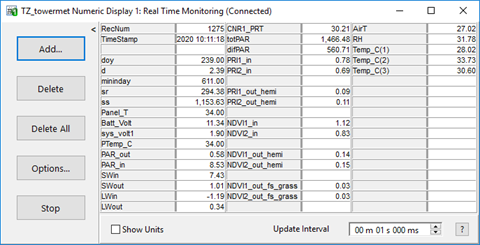
11 TZ_tmet graphs found
11 TZ_soilco2 graphs found
Can't check TZ_mixed
3 TZ_mixed graphs found
1 TZ_fflux graphs found
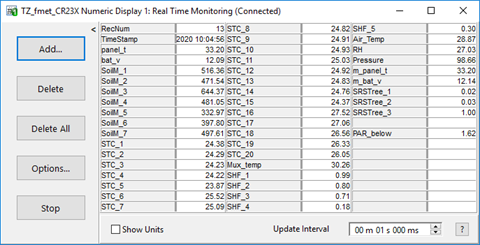
8 TZ_fmet graphs found
No data found for TZ_tram.
3 TZ_co2prof graphs found
1 TZ_irt graphs found
No data found for TZ_windprof.
1 TZ_tflux graphs found
2 TZ_sm graphs found
Can't check TZ_met
1 TZ_met graphs found
Can't check TZVR_mixed
8 TZ_osu graphs found
3 TZ_fd graphs found
Tonzi Z-cam data