Field Notes
<--2020-07-21 11:25:00 | 2020-08-21 10:00:00-->Other sites visited today: Bouldin Alfalfa | Bouldin Corn | West Pond
Phenocam link: Searching...
East End: 2020-08-05 10:45:00 (DOY 218)
Author: Daphne Szutu
Others:
Summary: Regular data collection/cleaning, no water under tower, installed water level sensor, measured water level, installed new Apogee NDVI sensors
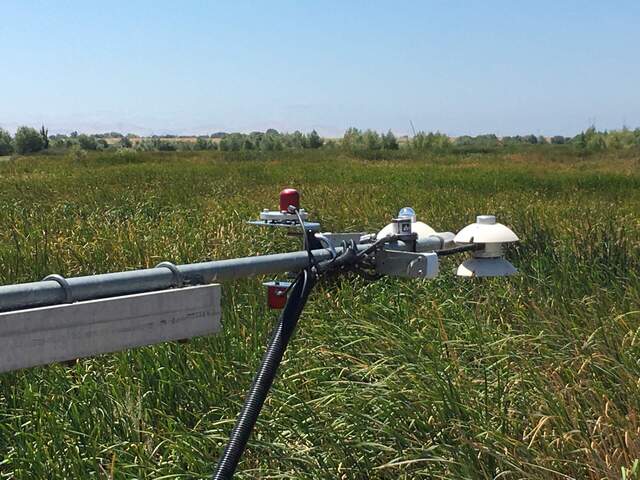
| 2020-08-05 East End I arrived at 10:45 PDT. It was breezy and warm, with clouds and fog towards the coast. It is still dry under the tower, and the water was below the bottom of the staff gauge. There was no water inside the well pipe, either. All the water sensors (eosGP, conductivity, miniDOT) were measuring air. About 1/3 of the plants were yellow, maybe from water stress. I downloaded met, camera, and USB GHG data. This was the first collection of picam images, and they looked fine. I swapped out the picam power cable for a shorter one and then checked that the picam was running and the clock looked good. I cleaned flux and rad sensors and topped of the wash reservoir. I tried cleaning up the wiring inside the met box and the cabling leading up to it, but I'm not sure it made a difference. I added the water level sensor sn 70011229 to the well pipe. I measured the well depth with a tape measure. Top of well to ground outside pipe = 41 cm Top of well to sensor = 63 cm Top of well to bottom of well inside pipe = 66 cm (dry at bottom of well) I added a pair of the new Apogee NDVI sensors. Sn 1053 was installed in the incoming position and sn 1054 was installed in the outgoing position. After uploading a new CR1000 program, NDVI_in was 1.37 and NDVI_out was 0.11. LI-7500 readings: CO2 400ppm H2O 680ppm T 22.7C P 101.2kPa SS 101 --> 102 LI7700 readings: CH4 1.88ppm RSSI 36 --> 80 after cleaning I left at 13:20 PDT. |
1 photos found

20200805EE_ApogeeNdvi.jpg ( 2020-08-05 13:21:55 ) Full size: 1920x1440
Pair of new Apogee NDVI sensors (red casing) installed at EE
11 sets found
14 EE_met graphs found
Can't check EE_mixed
1 EE_mixed graphs found
8 EE_flux graphs found
Can't check MBWPEESWGT_mixed
1 EE_cam graphs found
Can't check MBEEWPSWEPGT_cam
Can't check SIMBTWEE_met
Can't check EE_Temp
5 EE_Temp graphs found
Can't check EE_minidot
1 EE_minidot graphs found
Can't check MBSWEEWPBCBA
1 EE_processed graphs found

