
Field Notes
<--2020-07-30 14:55:00 | 2020-08-11 12:55:00-->Other sites visited today: Bouldin Alfalfa | East End | West Pond
Phenocam link: Searching...
Bouldin Corn: 2020-08-05 14:00:00 (DOY 218)
Author: Daphne Szutu
Others:
Summary: Regular data collection/cleaning, corn senescencing, field had been flooded and ground muddy now, removed zPAR sensors, FD box was flooded but data/chambers were ok, measured water level, missing 6 days of photos
| 2020-08-05 Bouldin Corn I arrived at 14:00 PDT. It was breezy and mild, and there was a long layer of fog over Mt. Diablo and the hills next to it. The corn is senescing, with brown edges on even the top leaves. The ground was wet, and soft enough to leave bootprints. Based on the water level sensor, the farmers had started adding water by 8/27. The water came up to ~10 cm aboveground. Two of the 3 FD chambers had the regular collar (~2cm tall) and were partly submerged. The 3rd FD chamber has a taller collar (~30 cm tall) and was not affected by the flood. I downloaded met, camera, and USB GHG. I removed the undercanopy PAR sensors (sn 030381 and sn 040412) and sent a new program to the CR1000. I removed 2 of the 4 thin rods that used to hold the picams against the ground. There are 2 more rods that I couldn’t find today. I topped the wash reservoir off and cleaned the flux and rad sensors. The box with the FD cables was half flooded inside. The screw terminal with the power wires was half submerged but the other screw connectors were dry. I replaced the screw terminal and surprisingly, I could still connect to the chambers. They seemed to have their full set of data. I downloaded the data but did not clear the chambers. I also measured the water level with a tape measure. There was a black widow with 2 egg sacs inside the well. Top of well to ground = 47 cm Top of well to water surface = 69 cm LI-7500 readings: CO2 405ppm H2O 662ppm T 26.0C P 100.6kPa SS 103-->103 after cleaning LI7700 readings: CH4 1.9ppm RSSI 47-->86 after cleaning I left at 15:45 PDT. Back in the lab, the phenocam card was missing photos since 7/30. The ethernet switch, which is usually perched on top of the AM25, had fallen to the bottom of the datalogger box. I think this fall accidentally unplugged it, so there was no connection between the phenocam and the card. I placed the switch back on top of its perch, but I don't remember if I specifically checked the connection. I'll check it next time. |
3 photos found

20200805BC_FloodedFdChamber.jpg ( 2020-08-05 15:30:56 ) Full size: 1440x1920
Corn field was heavily irrigated, water came up to about 10cm above the soil surface as observed from the high water line on the FD chamber

20200805BC_FloodedBox.jpg ( 2020-08-05 14:25:49 ) Full size: 1440x1920
Box on the ground was flooded during this summer's irrigation that had water about 10cm above the soil surface. Half of the screw terminal was underwater, but luckily the eosFD twist connections were dry. Surprisingly, the eosFD chambers seemed fine and were recording data the whole time.
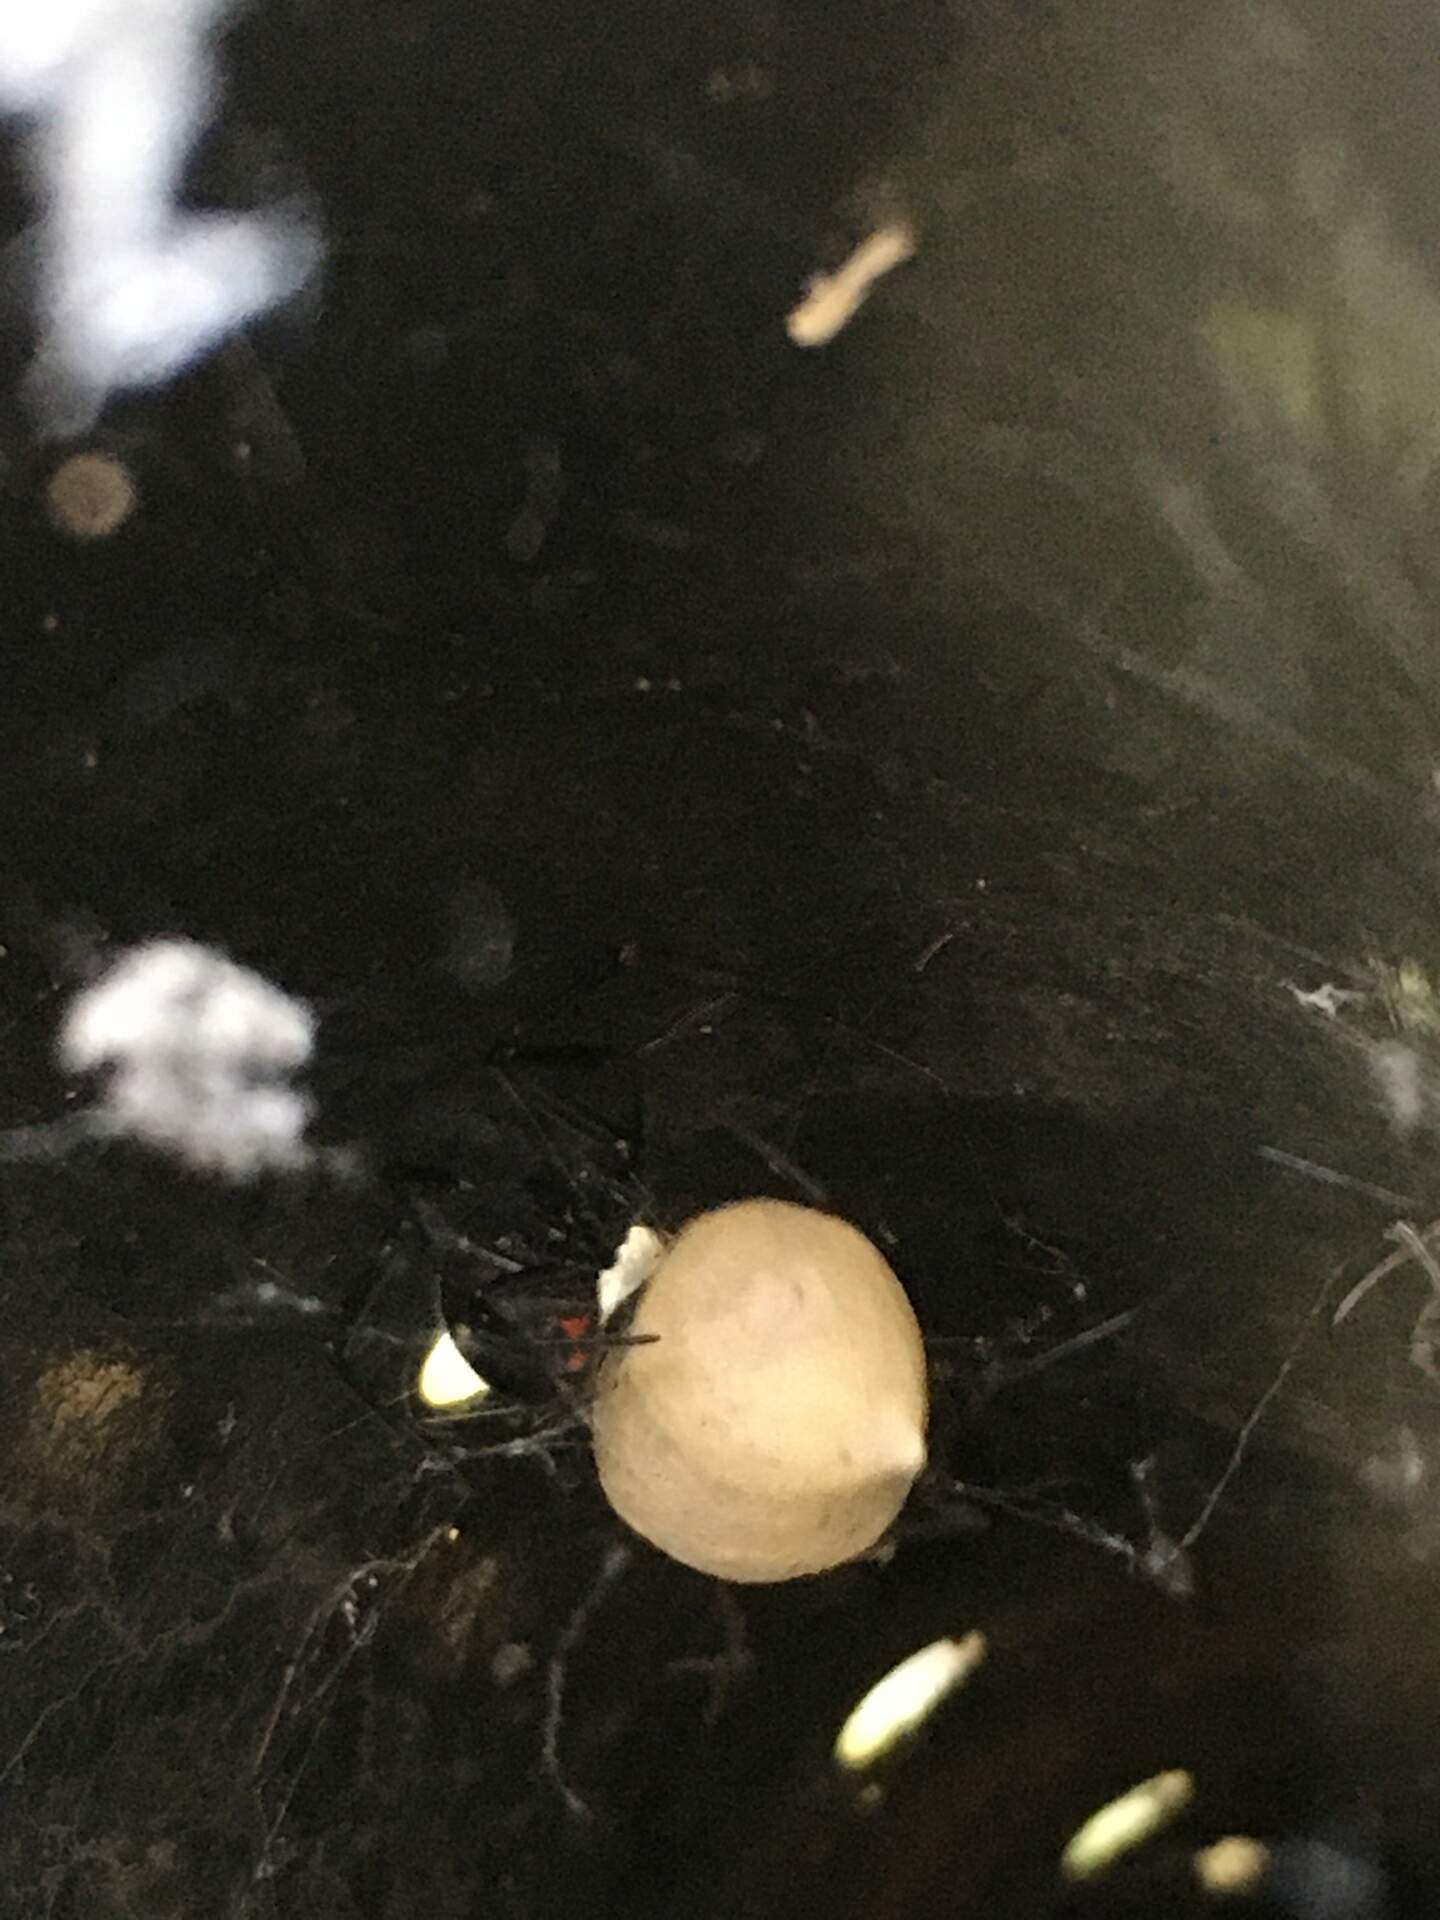
20200805BC_BlackWidowEggSac.jpg ( 2020-08-05 15:08:44 ) Full size: 1440x1920
Black widow spider and 2 egg sacs in the corn tower well pipe
6 sets found
17 BC_met graphs found
5 BC_flux graphs found
Can't check TATWBABCSB_cam
Can't check MBSWEEWPBCBA
No data found for BC_pa.
1 BC_arable graphs found