
Field Notes
<--2020-04-27 00:00:00 | 2020-05-19 11:20:00-->Other sites visited today: East End | Bouldin Corn | West Pond | Sherman Barn
Phenocam link: Searching...
Bouldin Alfalfa: 2020-05-01 15:45:00 (DOY 122)
Author: Daphne Szutu
Others: Mike
Summary: Regular data collection/cleaning, windy, field is mowed, veg height, synced phenocam clock +16 min
| 2020-05-01 Bouldin Alfalfa Mike and I arrived at 15:45 PDT. It was a warm and windy spring day -- the perfect allergy trifecta. This is our 7th week of sheltering in place, with at least 4 more weeks to go. There were generally many tractors rumbling about on the dirt roads. Our field has been mowed, and there was a raker parked on our field. They were currently baling the field to our east. I took some videos and photos with a 360 camera. I downloaded met, camera, USB GHG, and both FD chambers. I cleared the FD chambers after the download. The reservoir was 20% empty; I refilled it. I cleaned flux and rad sensors and the camera window. I took vegetation height measurements but forgot spectral. I checked the eddy and phenocam clocks. The eddy clocks looked good. I changed the phenocam clock from 14:59 to 15:14 to match the laptop time. LI-7500 readings: CO2 412ppm H2O 323ppm T 28.1C P 101.6kPa SS 97--> 98 after cleaning LI7700 readings: CH4 1.86ppm RSSI 34-->72 after cleaning We left at 16:20 PDT. |
Next Mowing: 2020-06-04
3 photos found

20200501BA_MowedField.jpg ( 2020-05-01 16:16:51 ) Full size: 1920x1440
About 1 week after farmers mowed the field
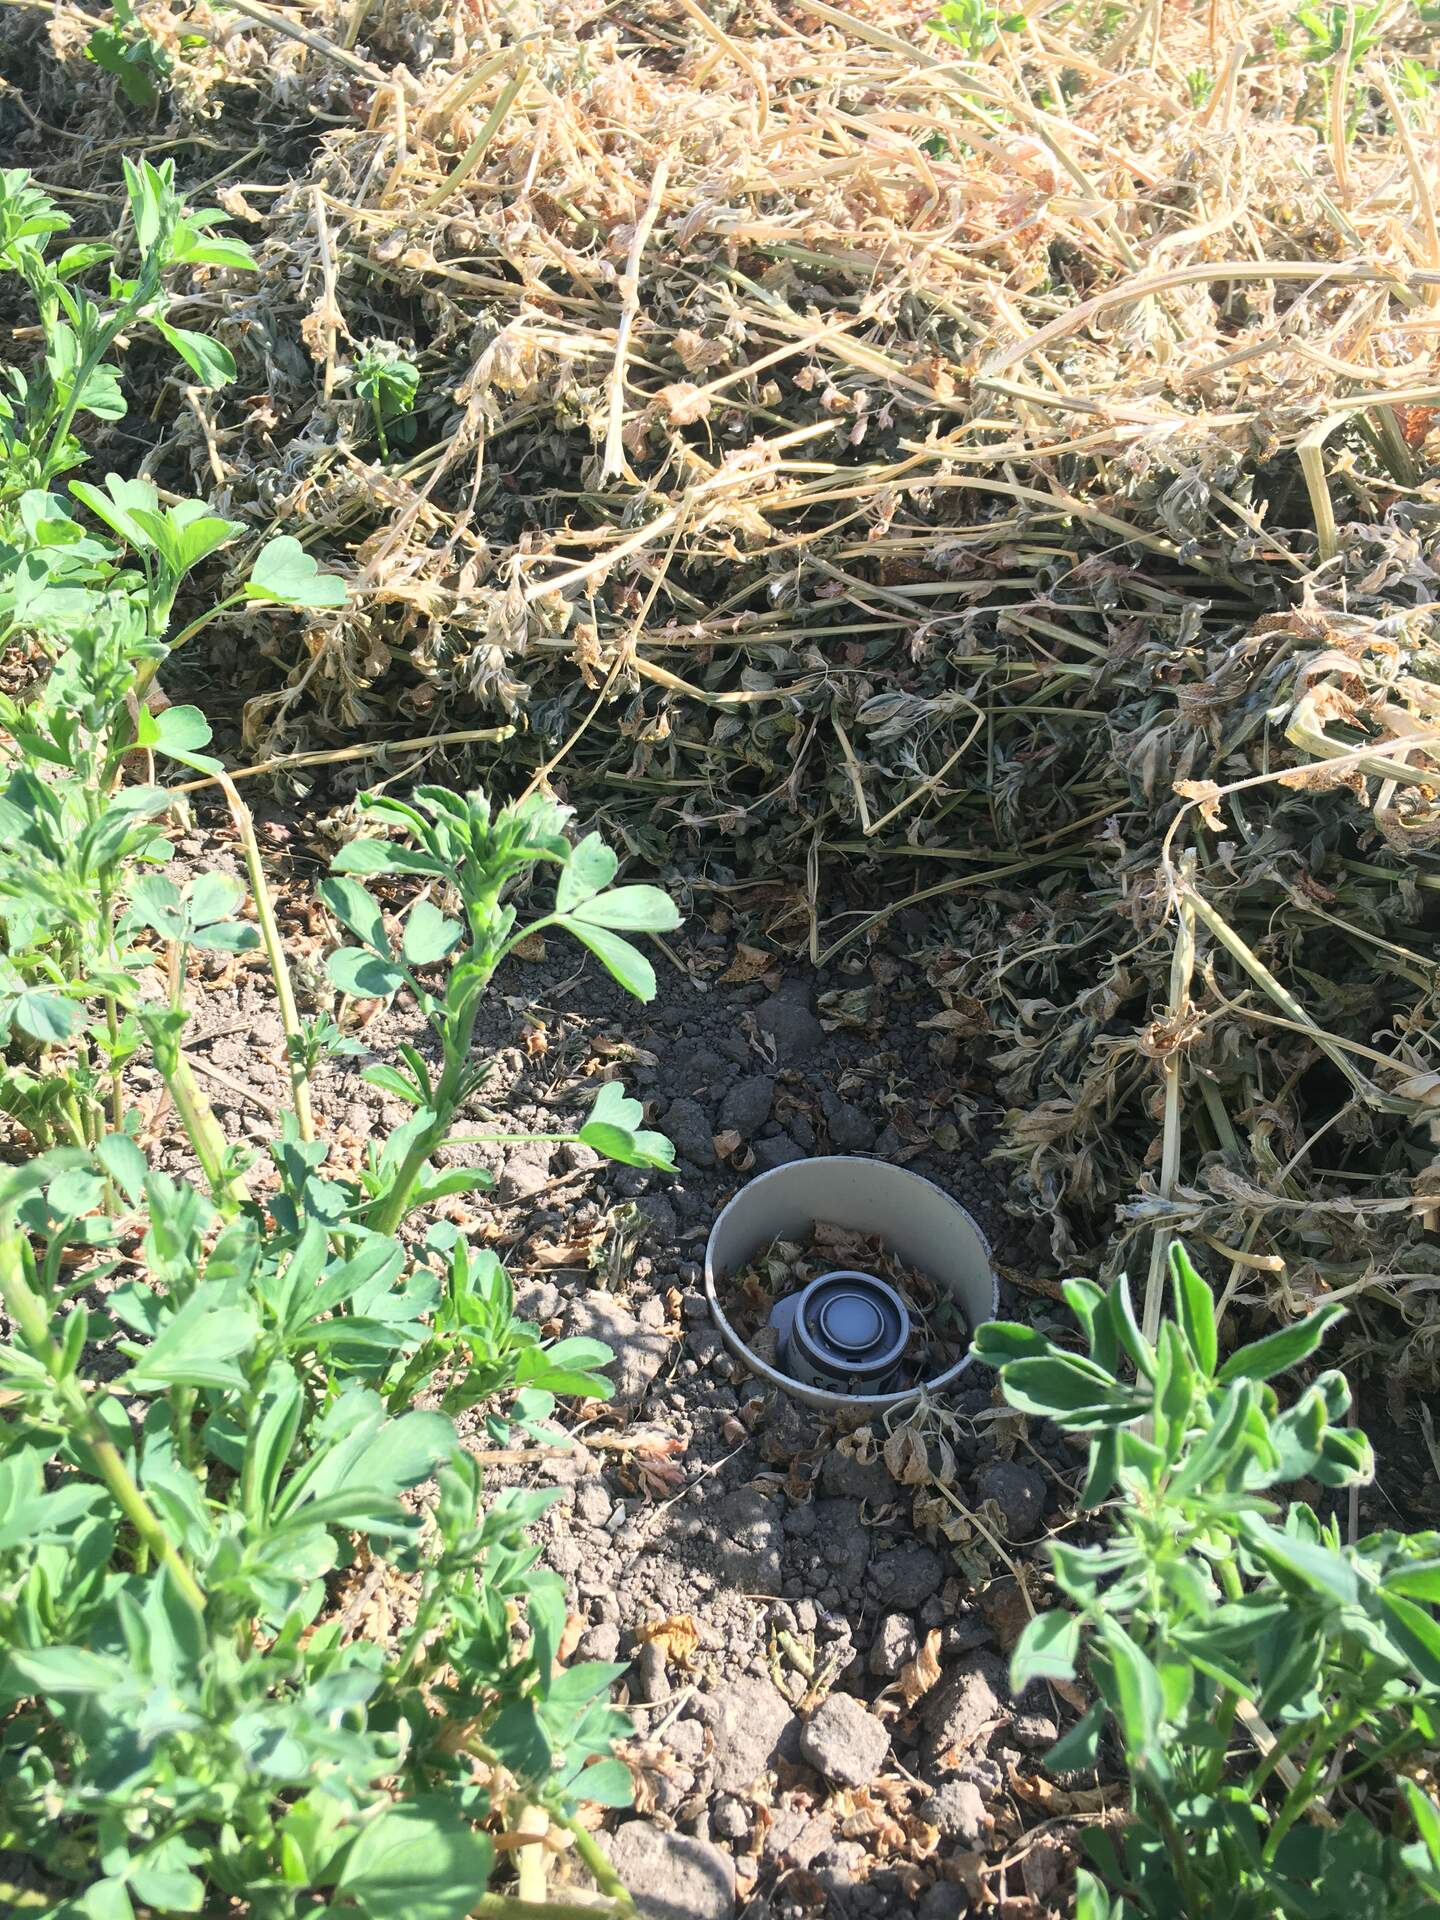
20200501BA_zPARShade.jpg ( 2020-05-01 16:08:46 ) Full size: 1440x1920
Pile of mowed alfalfa was shading the undercanopy PAR sensor

bouldinalfalfa_2020_05_01_151628.jpg ( 2020-05-01 15:16:34 ) Full size: 1296x960
Daphne at site about 1 week after mowing
7 sets found
5 BA_flux graphs found
21 BA_met graphs found
6 BA_arable graphs found
Can't check TATWBABCSB_cam
Can't check MBSWEEWPBCBA
2 BA_processed graphs found
No data found for BA_adex.