Field Notes

<--2020-01-30 13:00:00 | 2020-02-06 10:05:00-->
Phenocam link: Searching...

Sherman Wetland: 2020-02-04 10:45:00 (DOY 35)
Author: Patty Oikawa
Others:

Summary: LGR data download

Arrived 10:45am
Cold, windy, clear skies
Tank psi 35 with 600 left, but that’s what it was last time, suspicious
Re-started MIU to test if cal tank is working, it seems to be...not sure why psi didn’t go down more in the past month, new cal tank is ordered, hope to install next visit
No ants!

CO2=422ppm
D13C=-14.9per mil
D18O=-81.89per mill
H2O=323.5ppm
Gas temp=44.7C
P=119.77torr
Laser response=12.85us
Downloaded data

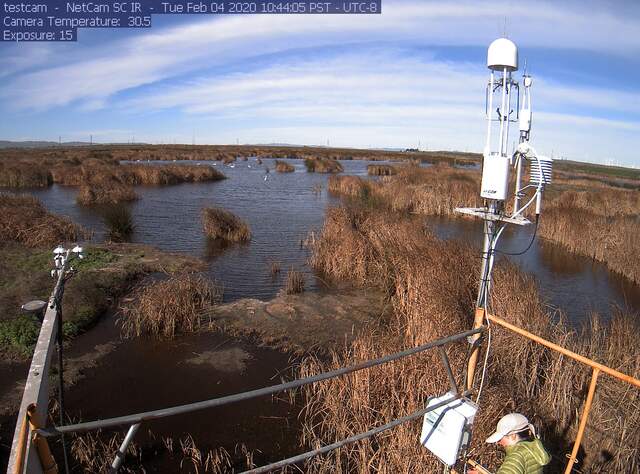
Replaced top and bottom inlet filters and blew out debris with compressed air.

1 photos found

Patty checking filters
siwetland_2020_02_04_104405.jpg ( 2020-02-04 10:59:28 ) Full size: 1296x960
Patty checking filters

Graphs display:
7 sets found

Can't check MBWPEESWGT_mixed
Can't check MBEEWPSWEPGT_cam
16 SW_met graphs found

Explore the graph:Temperatures in a new window

Explore the graph:Water Temperature Profile A in a new window

Explore the graph:Water Temperature Profile B in a new window

Explore the graph:Soil Temperature Profile C2 in a new window

Explore the graph:Soil Heat Flux in a new window

Explore the graph:Four channel Radiometer in a new window

Explore the graph:Sherman Wetland PAR in a new window

Explore the graph:PRI Channels in a new window

Explore the graph:NDVI Channels in a new window

Explore the graph:Water level and Rain in a new window

Explore the graph:Dissolved CO2 in a new window

Explore the graph:Air Pressure in a new window

Explore the graph:Battery Voltage and RH in a new window

Explore the graph:Soil Temperature Profile C1 in a new window

Explore the graph:SRS NDVI and PRI in a new window

Explore the graph:SW miniDOT Dissolved Oxygen in a new window

4 SW_flux graphs found

Explore the graph:CO2 and H2O in a new window

Explore the graph:Wind in a new window

Explore the graph:Methane in a new window

Explore the graph:Data Counts in a new window

Can't check MBSWEEWPBCBA
Can't check SW_Temp
14 SW_Temp graphs found

Explore the graph:Temperatures in a new window

Explore the graph:CO2 and H2O in a new window

Explore the graph:Wind in a new window

Explore the graph:Methane in a new window

Explore the graph:Data Counts in a new window

Explore the graph:Temperature Profile A in a new window

Explore the graph:Temperature Profile B in a new window

Explore the graph:Temperature Profile C in a new window

Explore the graph:Soil Heat Flux in a new window

Explore the graph:Four-channel radiometer in a new window

Explore the graph:NDVI Channels in a new window

Explore the graph:PAR in a new window

Explore the graph:Air Pressure and Water Level in a new window

Explore the graph:Air T and RH in a new window

3 SW_arable graphs found

Explore the graph:Incoming Solar Bands in a new window

Explore the graph:Reflected Solar Bands in a new window

Explore the graph:Solar Radiation in a new window