
Field Notes
<--2020-01-07 11:15:00 | 2020-02-06 15:25:00-->Other sites visited today: Sherman Barn | Sherman Wetland | West Pond | East Pond | East End | Bouldin Corn
Phenocam link: Searching...
Bouldin Alfalfa: 2020-01-23 12:30:00 (DOY 23)
Author: Daphne Szutu
Others: Camilo, Nicole K.
Summary: Regular data collection/cleaning, sheep on our field, LAI, spectral, veg height, measured sonic orientation
| 2020-01-23 Bouldin Alfalfa Camilo, Nicole, and I arrived at 12:30. It was an overcast and cool day with a thin layer of clouds. There were groups of sheep scattered on several alfalfa fields in our row of fields. On our field and on the field to our east, there were sheep on the western side of the field. In the northeast corner of our field, there was a small paddock of ewes and lambs. An electrical fence was set up across the whole field, so we were only able to drive partway to the tower. The alfalfa around our tower has not been grazed yet. I took 1-wand LAI measurements. Camilo took spectral measurements. Camilo and Nicole took veg height data with the water level tape (didn’t have our regular measuring tape). I downloaded met, camera, USB GHG, and FD data. The reservoir was 1/5 empty; we refilled it. Camilo and Nicole measured sonic orientation: on the compass it was 236 deg, on the phone compass it was 250 deg. LI-7500 readings: CO2 444ppm H2O 547ppm T 16.0C P 102.3kPa SS 100--> 101 after cleaning LI7700 readings: CH4 2.2ppm RSSI 57-->78 after cleaning We left at 13:15. |
Next Mowing: 2020-04-25
Veg Height (cm): Tape measure from ground to top of plant - Measured with water level tape instead of measuring tape
31.75, 27.94, 35.56, 30.48, 38.1, 20.32, 25.4, 30.48, 39.37, 35.56, 36.83, 35.56, 44.45, 35.56, 25.4, 36.83, 45.72, 29.21, 34.29, 31.75, avg = 33.5, stdev = 6.25
1 photos found
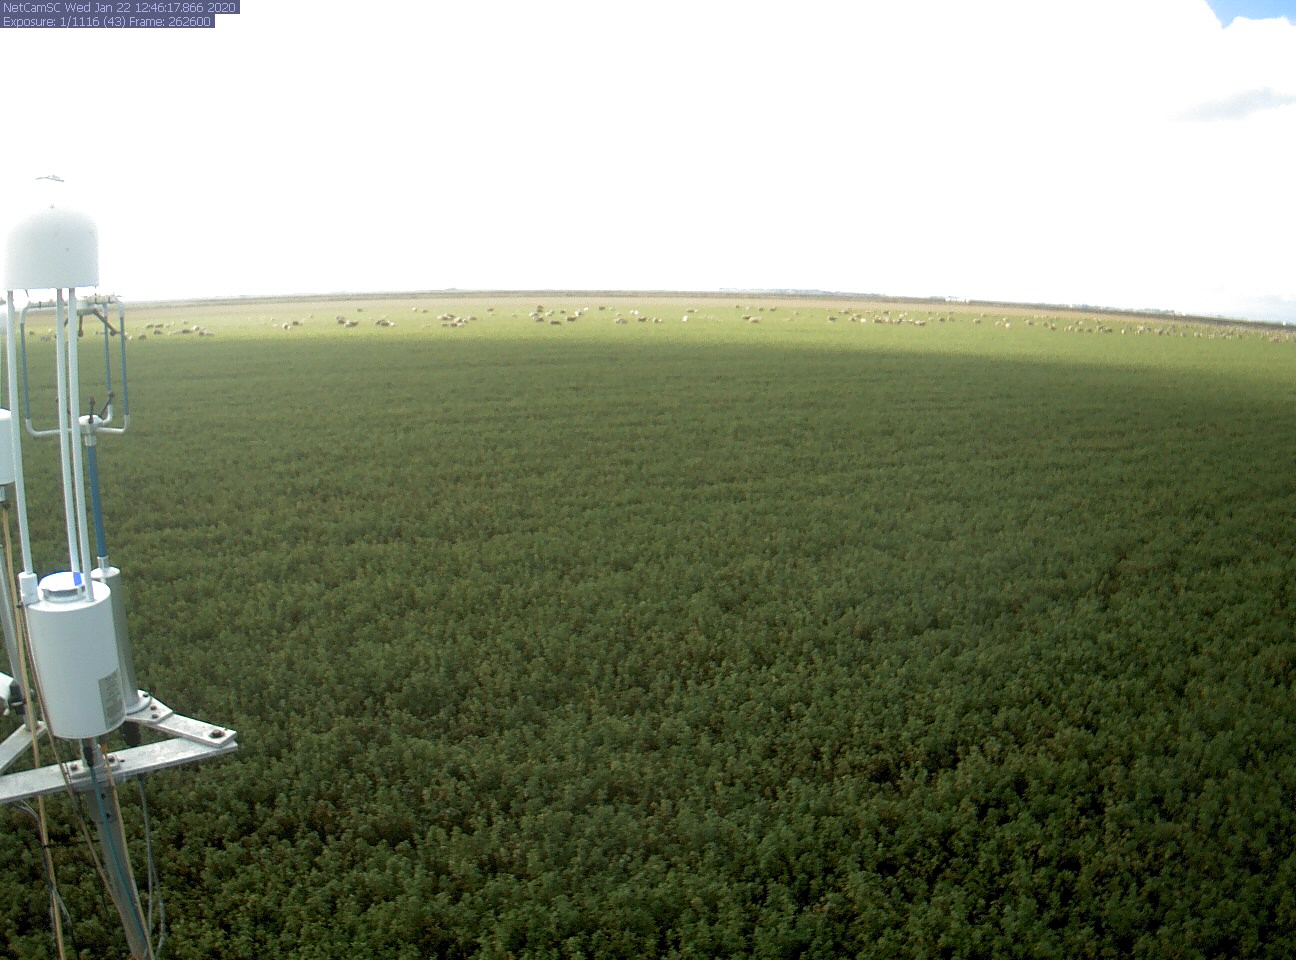
bouldinalfalfa_2020_01_22_124612.jpg ( 2020-01-22 12:59:18 ) Full size: 1296x960
Sheep grazing alfalfa
7 sets found
5 BA_flux graphs found
21 BA_met graphs found
6 BA_arable graphs found
Can't check TATWBABCSB_cam
Can't check MBSWEEWPBCBA
2 BA_processed graphs found
No data found for BA_adex.