
Field Notes
<--2019-11-07 09:15:00 | 2019-11-19 09:00:00-->Other sites visited today: Bouldin Alfalfa | East Pond | East End | West Pond
Phenocam link: Searching...
Bouldin Corn: 2019-11-14 09:50:00 (DOY 318)
Author: Daphne Szutu
Others: Alex
Summary: Regular data collection/cleaning, swapped 7500 for calibration, installed 3 eosFD chambers, no difPAR data (not fixed)
| 2019-11-14 Bouldin Corn Alex and I arrived at 9:50 after first dropping Ariane off at West Pond for water sampling. It was a mild, hazy, and sunny day with a few cirrus clouds. The wash reservoir was 1/5 full; I refilled it. Alex installed 3 eosFD chambers. These are on loan from eosense for a few months. Two chambers were by each of Tyler’s gas ports (sn FD20180067 to the north; sn FD20180048 to the south), and one (sn FD20180047) was in the unharvested area where there are some blown-down corn plants. Alex cleared the surface litter from the soil before installing each collar, and it was difficult to put the tie-down anchors into the hard soil. Yesterday in the lab I synced the chambers with the laptop time and set them to record measurements every 5 minutes. I connected the chambers to the 12V power inside the datalogger box. The chamber connectors are in a battery box to keep dust and water out; I need to find a brick or another small weight to place inside battery box to weigh it down (a hammer is in there temporarily). I collected met, camera, USB GHG, and PurpleAir data. It looks like there was another power for 2 days, 2019-11-05 to 2019-11-07. I cleaned flux and rad sensors. The radiometers were dusty. difPAR and totPAR were NAN or 0. I tried cycling power. Joe recommended connecting to the CR10X directly to see if any data is coming in. I swapped the LI-7500 for calibration: sn 75H-2669 came down and sn 0042 went up. I uploaded a new config file, updated the pressure coefficients, and reset the box. Afterwards, I confirmed the USB was logging, the GHG columns looked good, and there was no time error. LI-7500 readings (sn 75H-2669 --> sn 75H-2669 clean --> sn 75H-0042): CO2 425ppm --> 432 --> 425 H2O 547ppm --> 502 --> 506 T 19.1C --> 19.6 --> 19.9 P 101.3kPa --> 101.3 --> 101.6 SS 97 --> 103 --> 101 LI7700 readings: CH4 1.98ppm RSSI 34--> 83 after cleaning We left at 12:25. |
3 photos found
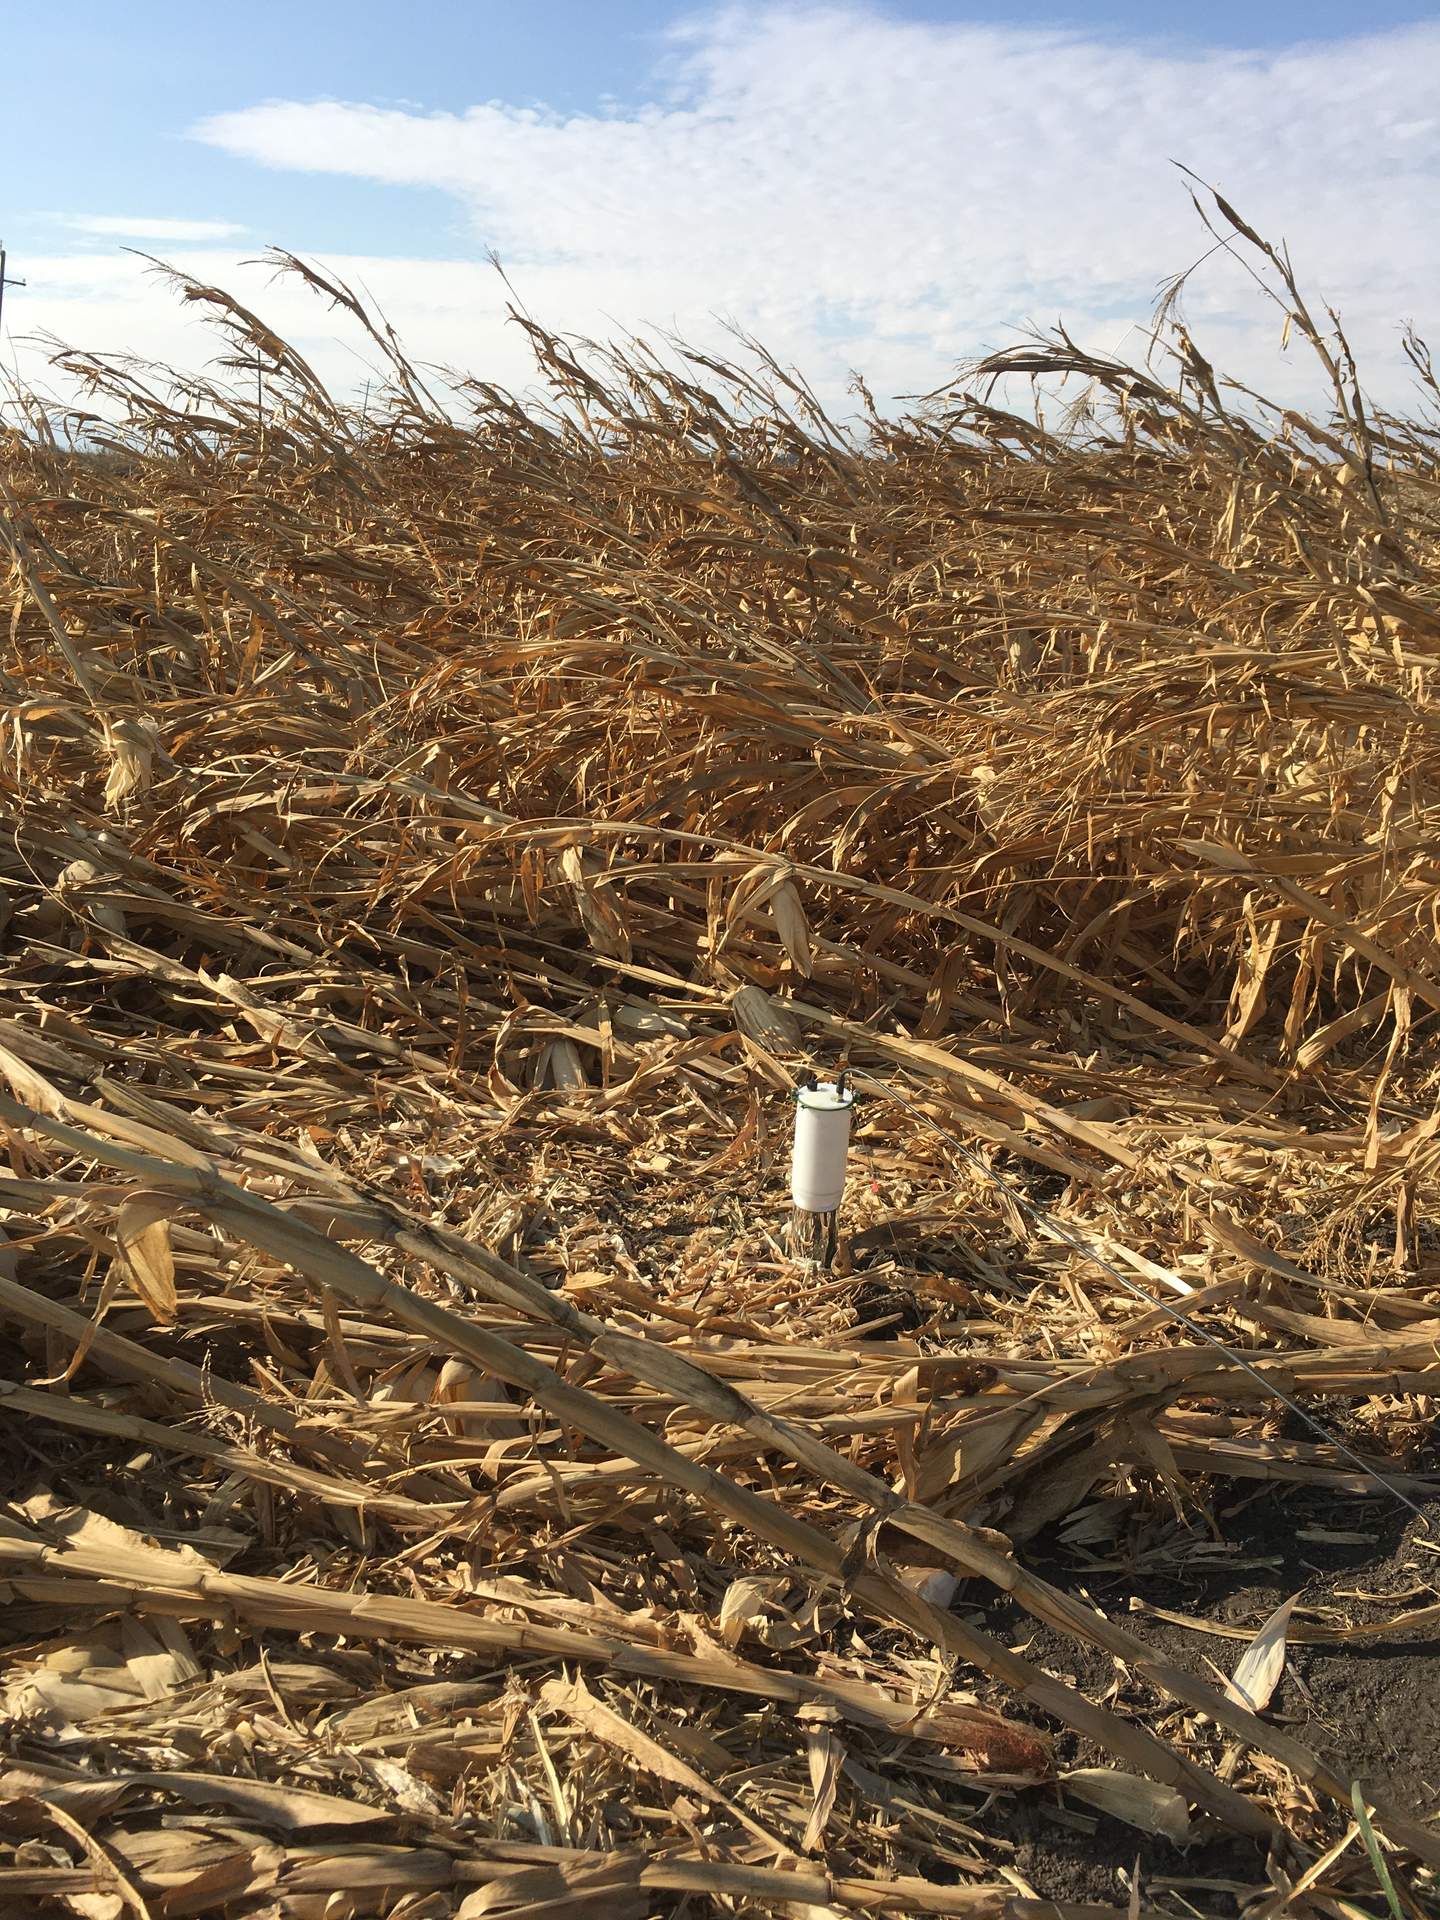
20191114BC_FdChambers2.JPG ( 2019-11-14 11:28:43 ) Full size: 1440x1920
One eosFD chambers at Bouldin Corn in the unharvested area of the corn. There are two other chambers in the harvested area of the field by Tyler's chambers and soil gas profile.
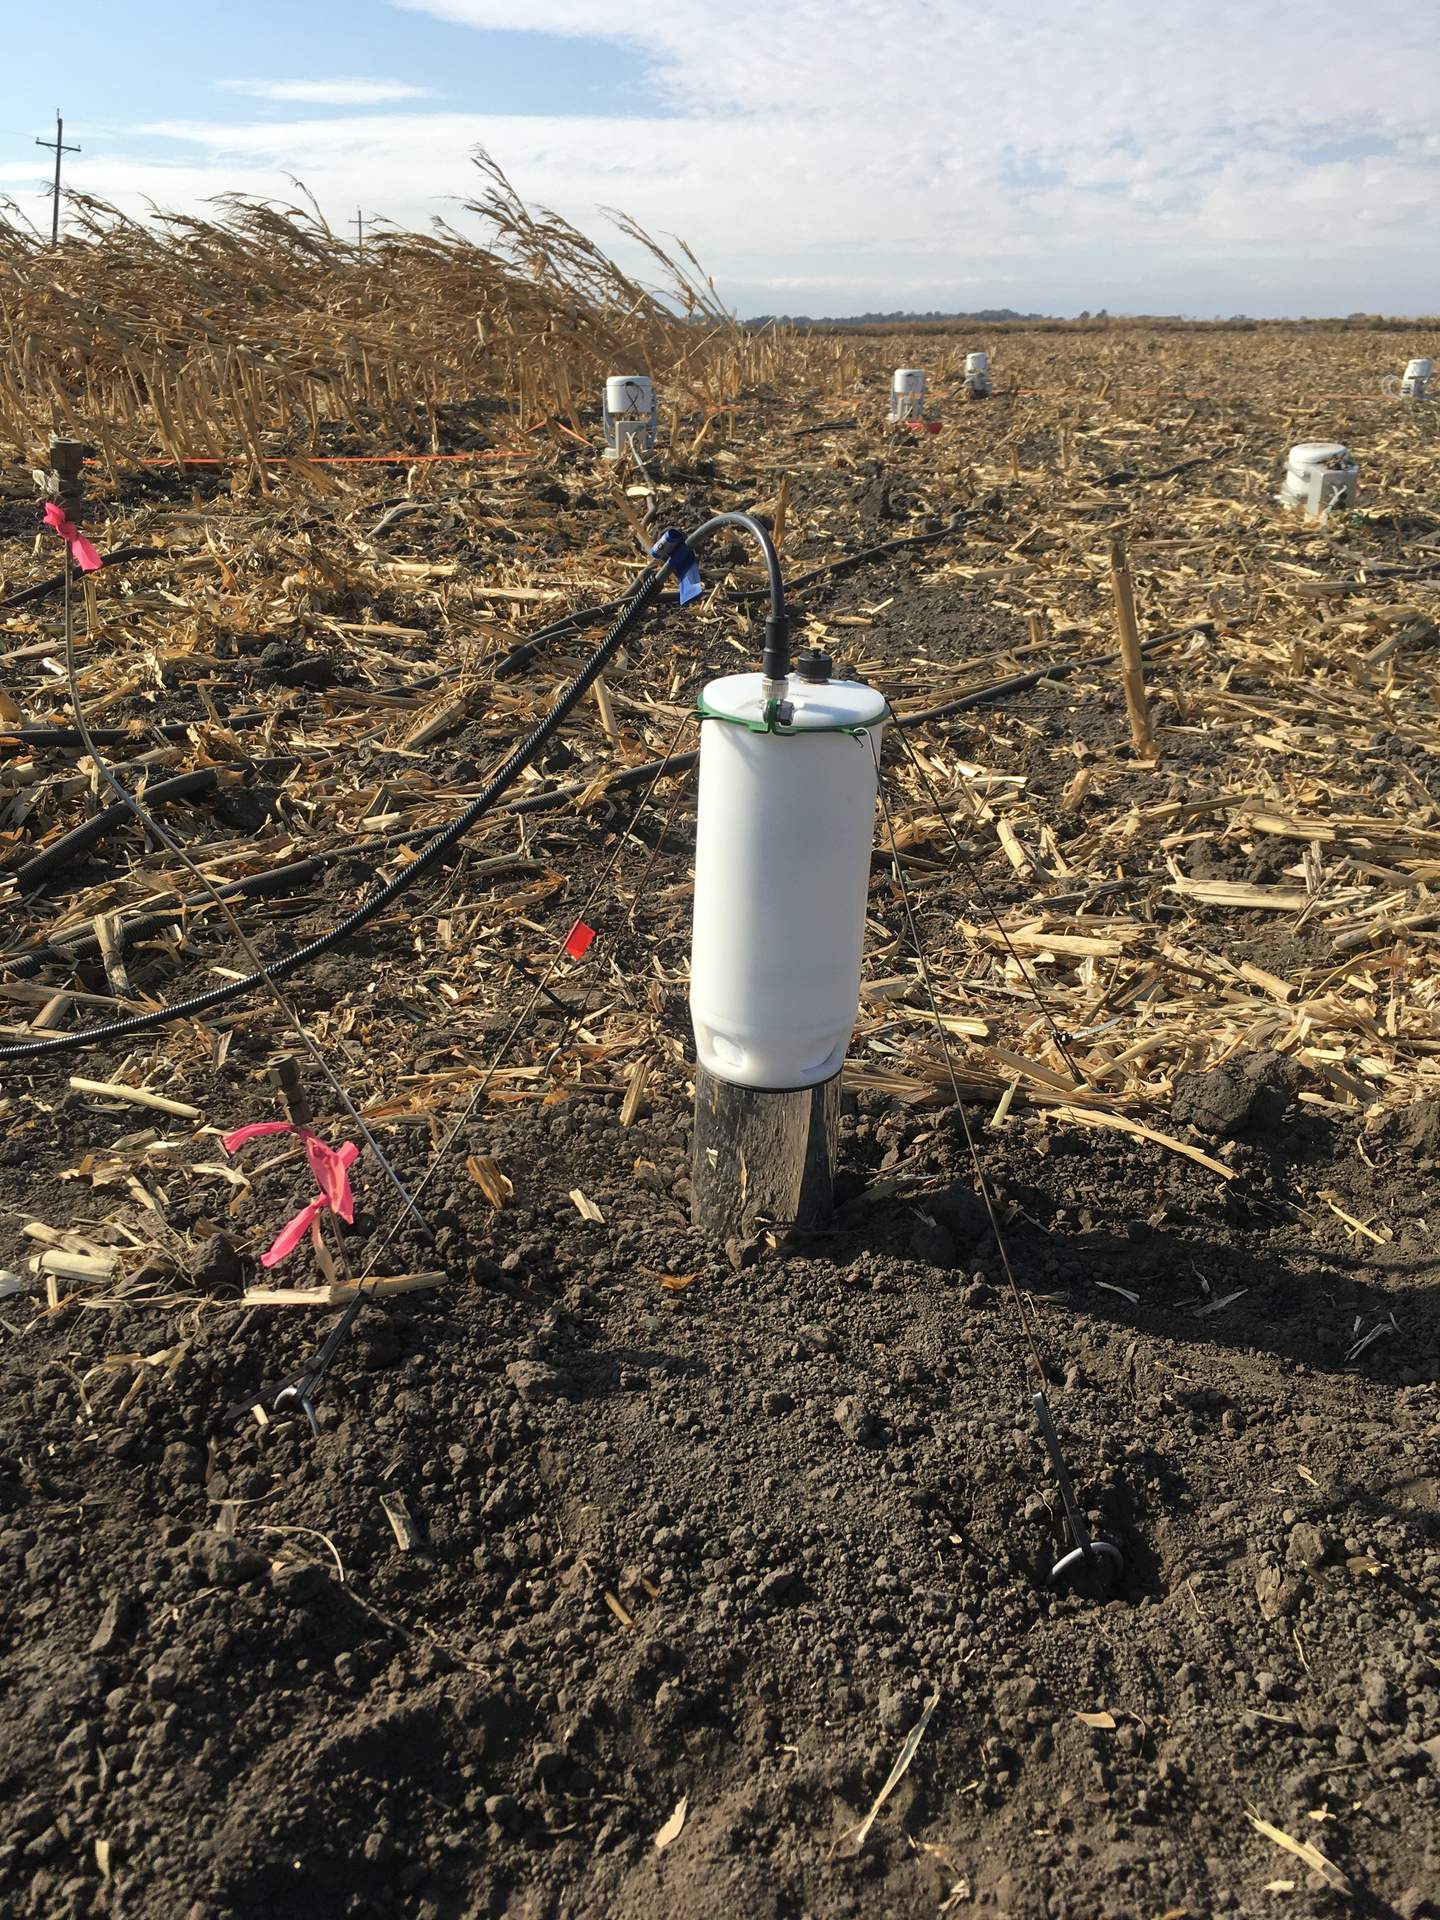
20191114BC_FdChamber.JPG ( 2019-11-14 11:28:09 ) Full size: 1440x1920
One of the two eosFD chambers at Bouldin Corn by Tyler's "gas ports" where he takes manual measurements from a soil gas profile. This is in the harvested area of the field.
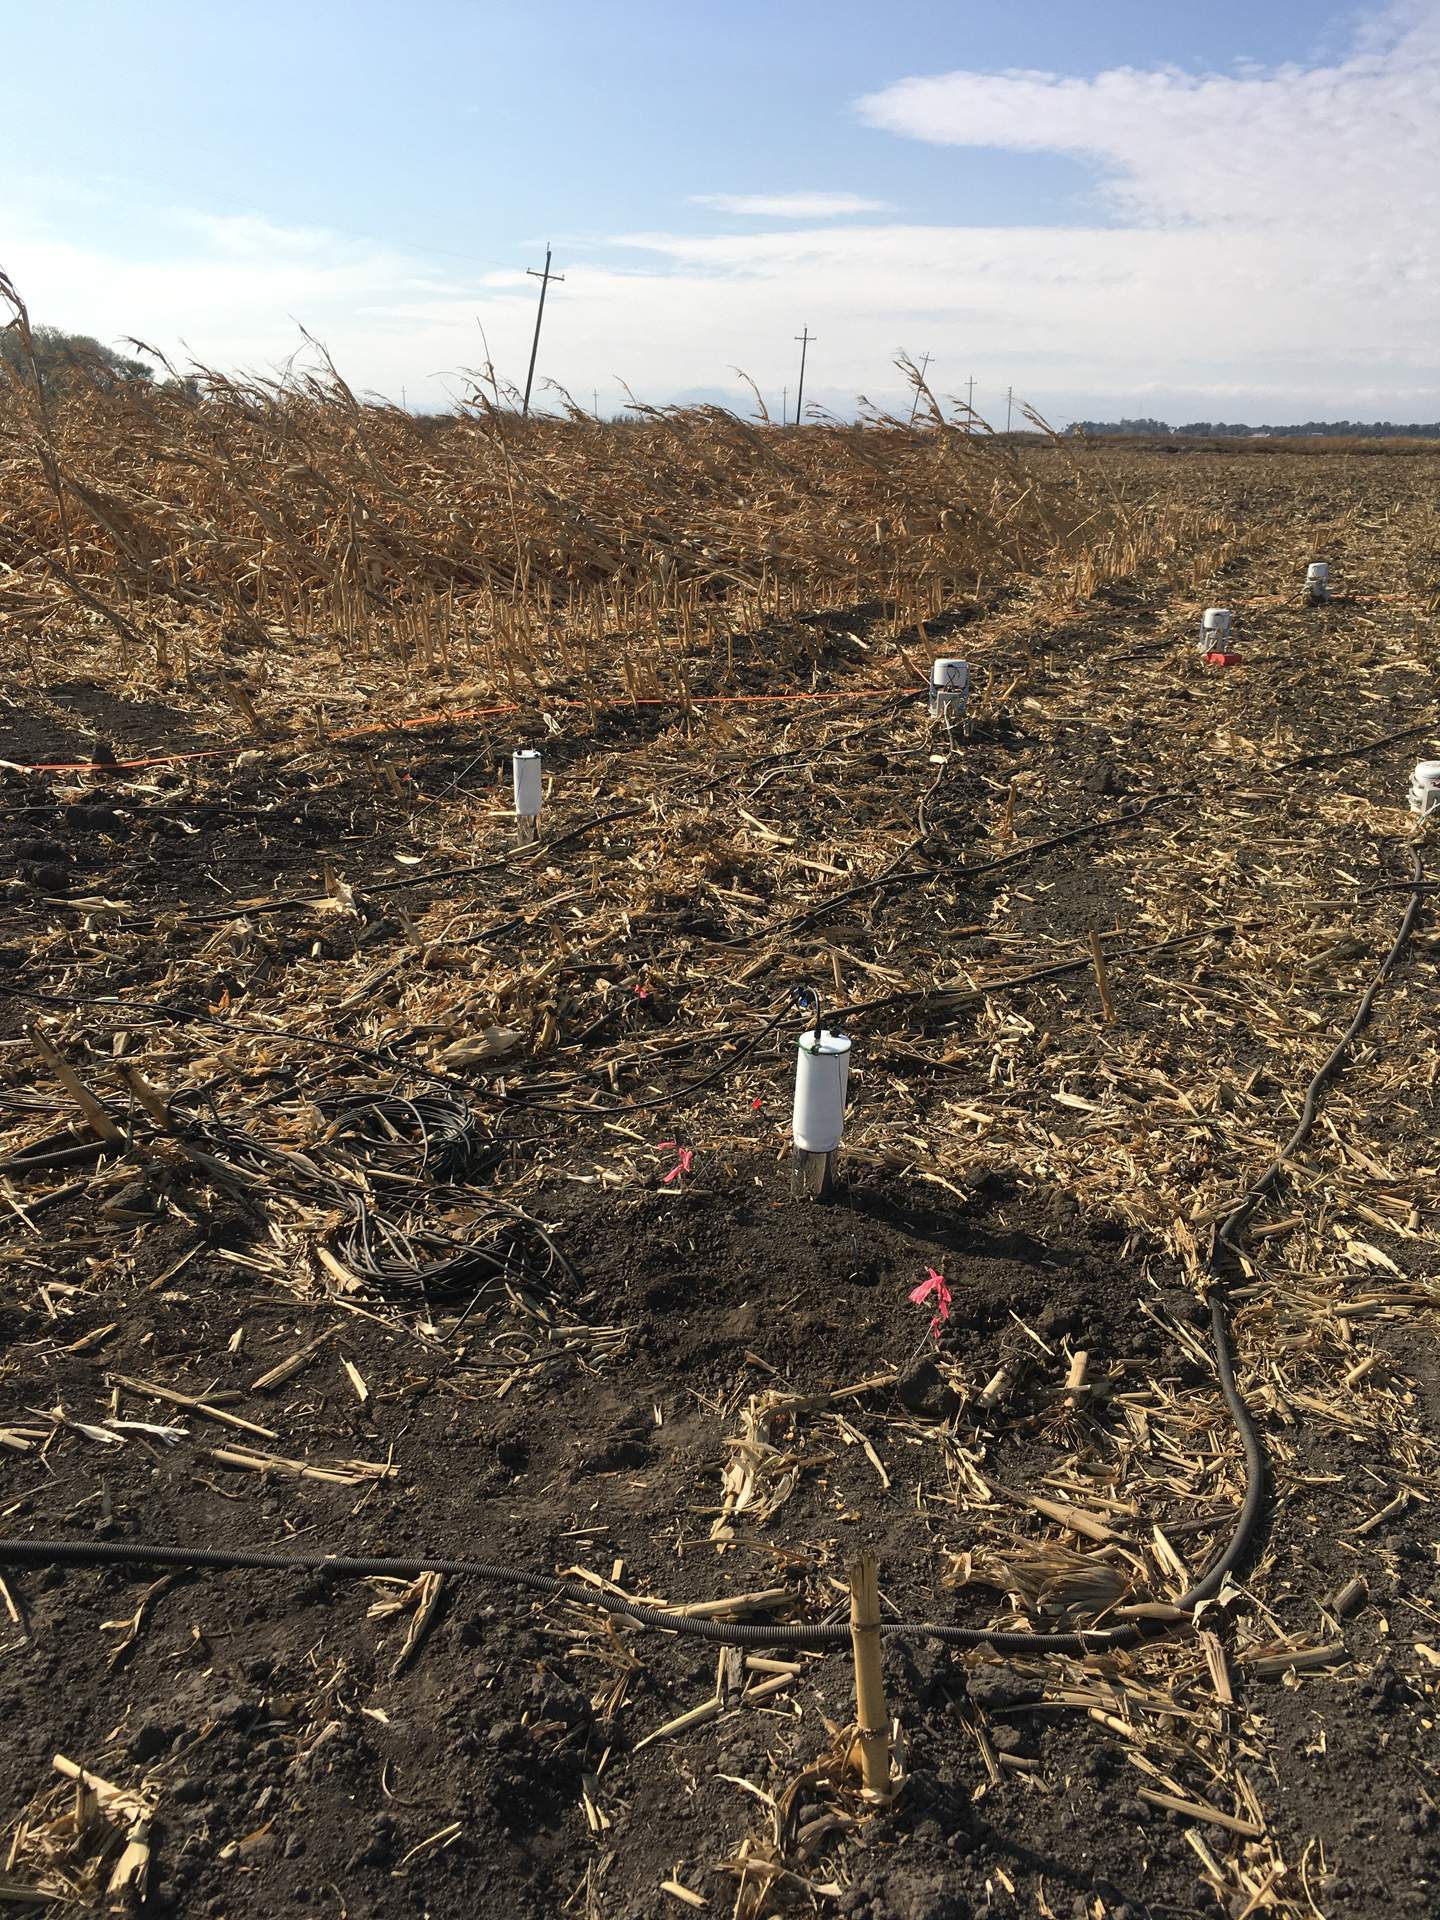
20191114BC_FdChambers1.JPG ( 2019-11-14 11:28:02 ) Full size: 1440x1920
Two eosFD chambers at Bouldin Corn by Tyler's "gas ports" where he takes manual measurements from a soil gas profile. This is in the harvested area of the field.
6 sets found
17 BC_met graphs found
5 BC_flux graphs found
Can't check TATWBABCSB_cam
Can't check MBSWEEWPBCBA
2 BC_pa graphs found
1 BC_arable graphs found