Field Notes

<--2019-09-28 14:30:00 | 2019-10-16 10:00:00-->
Other sites visited today: Bouldin Corn | East Pond | East End | West Pond | Sherman Barn | Mayberry | Bouldin Alfalfa

Sherman Wetland: 2019-10-02 15:15:00 (DOY 275)
Author: Daphne Szutu
Others: Camilo, Ariane

Summary: Regular data collection/cleaning, increased power and hours for 7700 heater

2019-10-02
Sherman Wetland

Camilo, Ariane, and I arrived at 15:15 PDT. It was a sunny and clear day with a gentle breeze. Bird sounds abounded. The water level was 85 cm. I didn’t see any creeping water primrose in the water. Duckweed is starting to colonize the water under the tower.

Ariane cleaned the precip bucket, which had a lot of bird poop. The wash reservoir was 90% full; we topped it off. I downloaded met, cam, and USB GHG. I adjusted the heater on the LI-7700 to match the BA heater settings because Robert said this site has been losing a lot of data in the early morning. II changed the power from 5% to 25%, and the heater time 18:00-9:00 to 18:00-11:00. I made these changes for both the top and bottom heater.

LI-7500 readings:
CO2 385ppm
H2O 325ppm
T 23.7C
P 101.5kPa
SS 97 --> 99
LI7700 readings:
CH4 2.07 ppm
RSSI 45--> 84 after cleaning

We left at 15:40 PDT.

2 photos found

Starling photo bomb
siwetland_2019_10_02_104405.jpg ( 2019-10-02 10:57:58 ) Full size: 1296x960
Starling photo bomb

Camilo cleaning eddy sensors
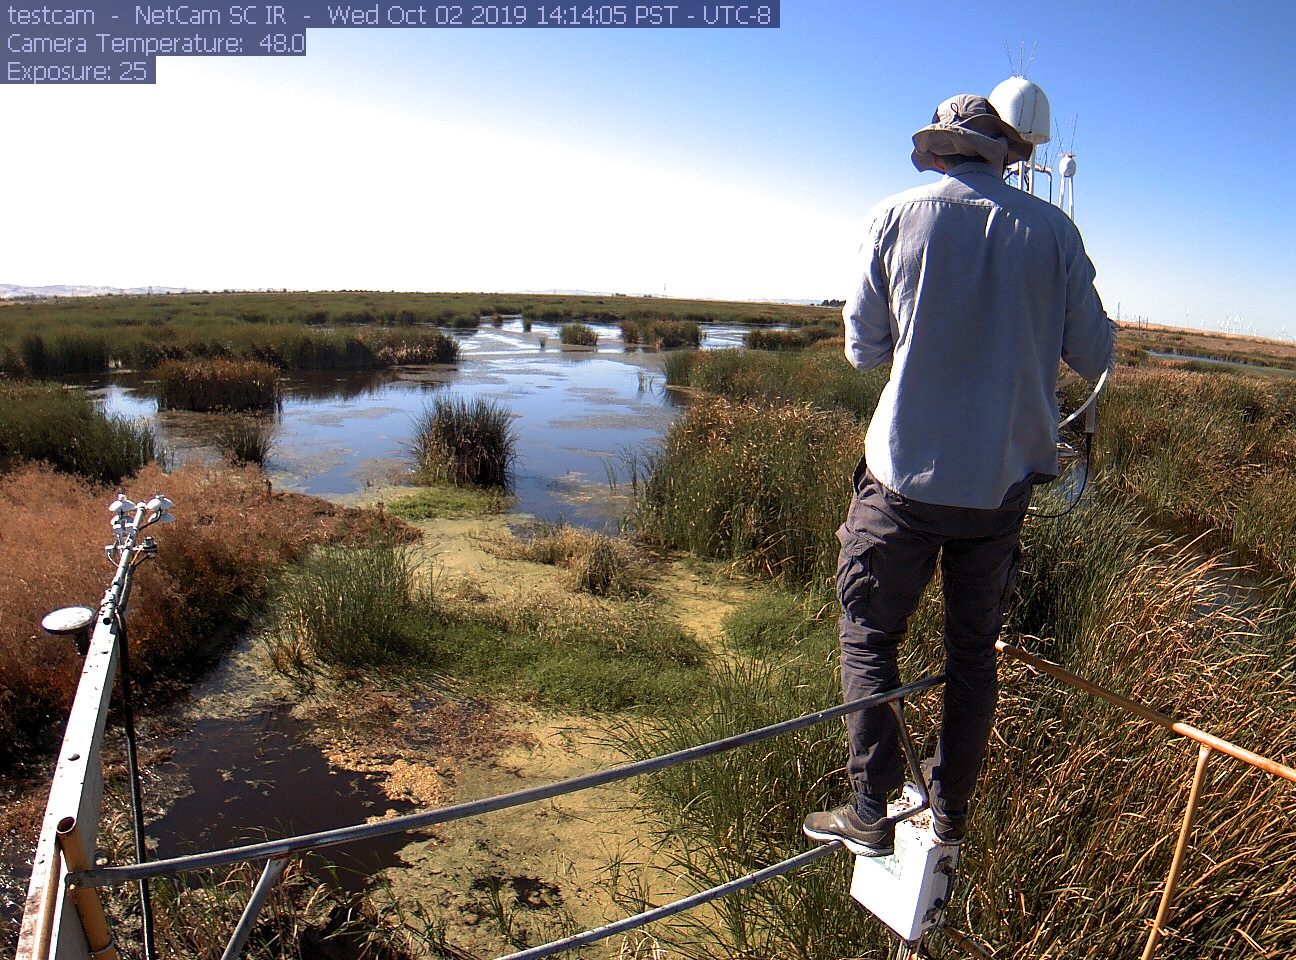
siwetland_2019_10_02_141405.jpg ( 2019-10-02 14:27:34 ) Full size: 1296x960
Camilo cleaning eddy sensors

Graphs display:
7 sets found

Can't check MBWPEESWGT_mixed
Can't check MBEEWPSWEPGT_cam
16 SW_met graphs found

Explore the graph:Temperatures in a new window

Explore the graph:Water Temperature Profile A in a new window

Explore the graph:Water Temperature Profile B in a new window

Explore the graph:Soil Temperature Profile C2 in a new window

Explore the graph:Soil Heat Flux in a new window

Explore the graph:Four channel Radiometer in a new window

Explore the graph:Sherman Wetland PAR in a new window

Explore the graph:PRI Channels in a new window

Explore the graph:NDVI Channels in a new window

Explore the graph:Water level and Rain in a new window

Explore the graph:Dissolved CO2 in a new window

Explore the graph:Air Pressure in a new window

Explore the graph:Battery Voltage and RH in a new window

Explore the graph:Soil Temperature Profile C1 in a new window

Explore the graph:SRS NDVI and PRI in a new window

Explore the graph:SW miniDOT Dissolved Oxygen in a new window

4 SW_flux graphs found

Explore the graph:CO2 and H2O in a new window

Explore the graph:Wind in a new window

Explore the graph:Methane in a new window

Explore the graph:Data Counts in a new window

Can't check MBSWEEWPBCBA
Can't check SW_Temp
14 SW_Temp graphs found

Explore the graph:Temperatures in a new window

Explore the graph:CO2 and H2O in a new window

Explore the graph:Wind in a new window

Explore the graph:Methane in a new window

Explore the graph:Data Counts in a new window

Explore the graph:Temperature Profile A in a new window

Explore the graph:Temperature Profile B in a new window

Explore the graph:Temperature Profile C in a new window

Explore the graph:Soil Heat Flux in a new window

Explore the graph:Four-channel radiometer in a new window

Explore the graph:NDVI Channels in a new window

Explore the graph:PAR in a new window

Explore the graph:Air Pressure and Water Level in a new window

Explore the graph:Air T and RH in a new window

3 SW_arable graphs found

Explore the graph:Incoming Solar Bands in a new window

Explore the graph:Reflected Solar Bands in a new window

Explore the graph:Solar Radiation in a new window