
Field Notes
<--2019-09-04 11:10:00 | 2019-10-02 15:50:00-->Other sites visited today: Sherman Barn | Sherman Wetland | West Pond | East Pond | East End | Sherman Wetland
Phenocam link: Searching...
Mayberry: 2019-09-18 10:35:00 (DOY 261)
Author: Joe Verfaillie
Others: Daphne
Summary: Recent rain including today, water level is low - mud visible, serviced water sensors, found beaver felled tree.
| Mayberry 2019-09-18 Daphne and I arrived at 10:35. It was overcast and mild with two short bouts of light rain. The water level was 14cm. This is very low – mud was visible on the south side of the tower and back along the boardwalk. I think I saw some beavers along the levee road on the way in and we found a dead willow tree cut down by beavers. The 7500 read: 362.9ppm CO2, 822.1mol/m3 H2O, 22.3C, 101.2kPa, 91.7SS After cleaning: 395ppm CO2, 707.0mmol/m3 H2O, 102.5SS The 7700 read: 1.92ppm CH4, 55.5RSSI – 85.1 after cleaning The 7700 RH was 31% and there was a red Replace Desiccant! warning in the software. The reservoir was topped up. There were some ants in the data logger box we left them some mothballs. We pulled up the water sensors. There seemed to be a variety of eggs on the outside of the sensors but the fluorometer windows looked clean. The CO2 and miniDot could use new copper mesh and we should replace the rotting metal chain with a plastic one. We collected the miniDot data and swapped its desiccant. Because the water level is so low the water sensor boom is angled down to where the bucket float is at the end. This results in the sensors being slightly higher in the water. The upper DO sensor window is just under water. The bucket should prevent the upper sensors ending up in the mud if the water level drops even lower. The water level desiccant was replaced. We collected water sample for Isabel at 9:40PST. The Rnet over water was leveled again adjusting it slightly back to the north. The PAR over water had spider webs on it and its cable is coming loose – maybe needs more glue or an L-bracket. The CR1000 program update seemed to fix the NaNs in the water level data. |
1 photos found
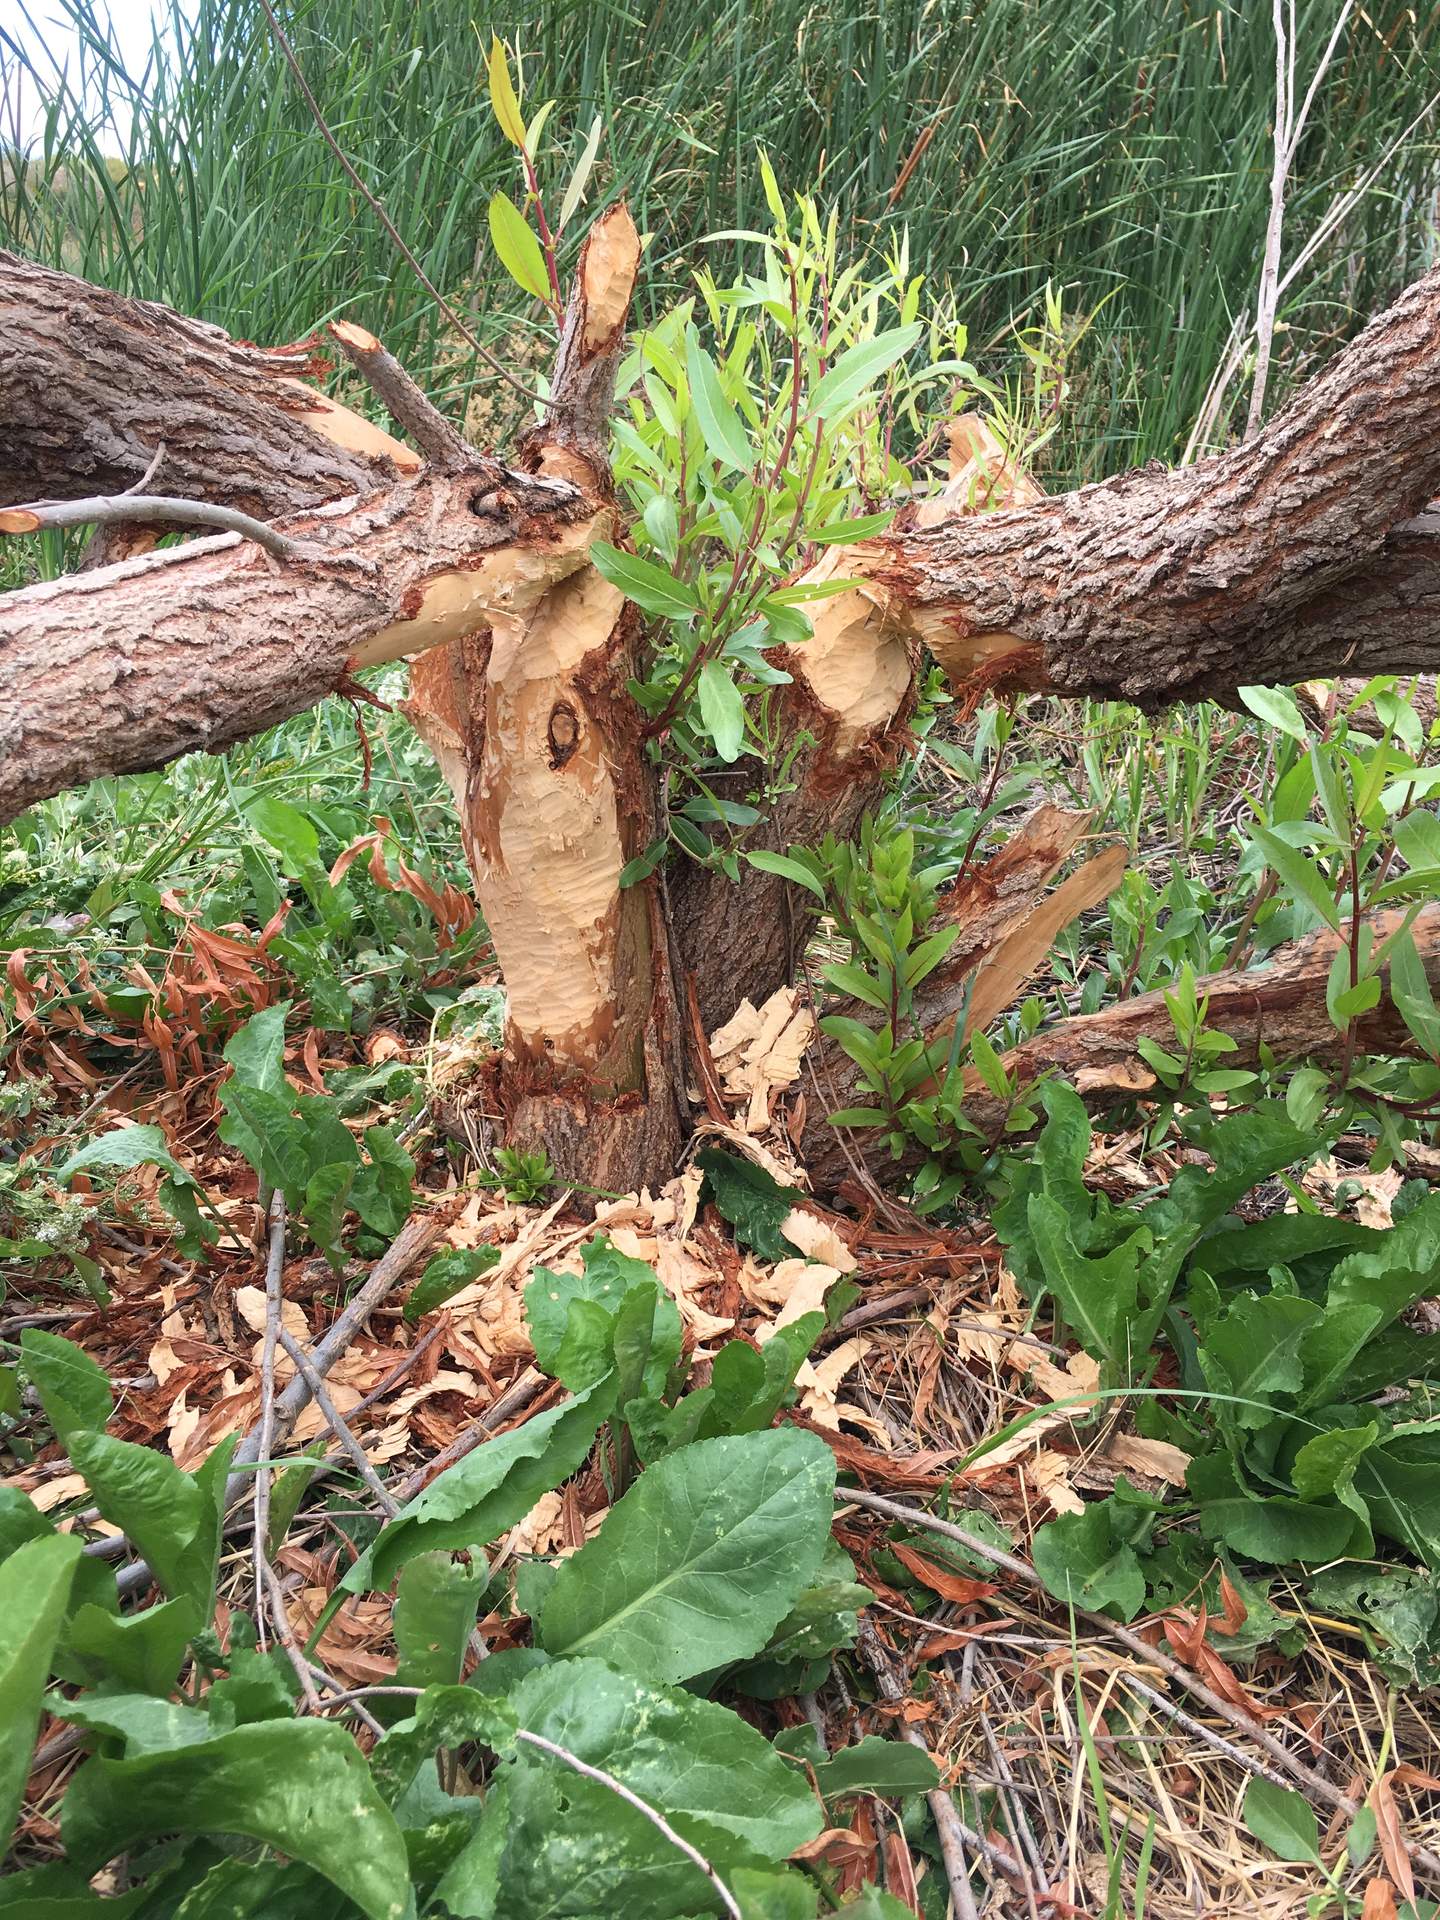
20190918MB_BeeverTree.jpg ( 2019-09-18 00:00:00 ) Full size: 1440x1920
Tree killed by beavers
11 sets found
7 MB_flux graphs found
No data found for MB_met.
28 MB_tule graphs found
Can't check MBWPEESWGT_mixed
1 MB_cam graphs found
Can't check MBEEWPSWEPGT_cam
Can't check SIMBTWEE_met
1 MB_minidot graphs found
Can't check MBSWEEWPBCBA
1 MB_processed graphs found
Can't check MB_fd
1 MB_fd graphs found