Field Notes
<--2010-07-28 09:00:00 | 2010-08-05 13:30:00-->Other sites visited today: Twitchell Rice | Sherman Island | Twitchell Rice
Phenocam link: Searching...
Sherman Island: 2010-07-28 09:00:00 (DOY 209)
Author: Jaclyn Hatala
Others: Joe
| Sherman: Took measurements with the LAI-2200 along the 200m transect. Clipped 5 biomass/LAI plots for lab analysis - mean LAI as measured by the lab scanner was 3.8. LAI seems to be increasing over the past few weeks at Sherman. Took Moisture Point measurements inside the enclosure - was a little wetter than last week. Water table depth is around 52cm. All the Vaisala soil CO2 probes are in good working order. I collected 9 reflectance spectra measurements from the flux footprint. I also took 2 soil depth profiles from the surface down to 65cm (5 samples in each profile) and analyzed them for CH4/CO2 flux on the LGR/LI-820 in the lab when returning. Have to analyze the data more closely, but at first glance it looks like CO2 flux was huge at depths below about 40cm, so microbial activity, soil subsidence, or both are really at work right now. Methane flux was close to zero for all samples, even when I ran the system in anoxic (N2 only) conditions to eliminate methanotrophy.
|
5 photos found
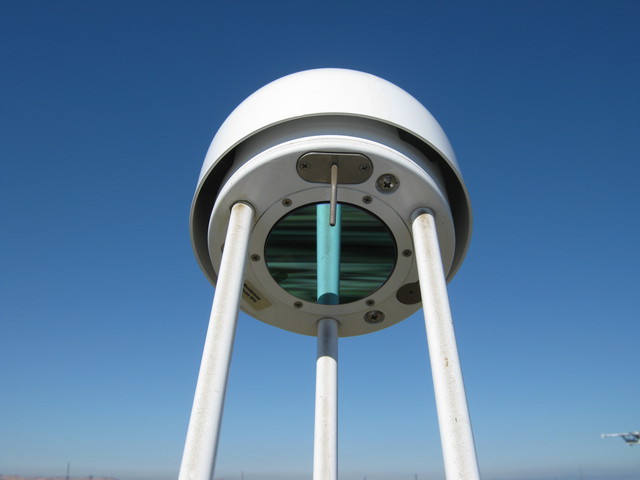
20100728SI_DustyLI7700.jpg ( 2010-07-28 10:15:48 ) Full size: 3648x2736
Top mirror of LI-7700
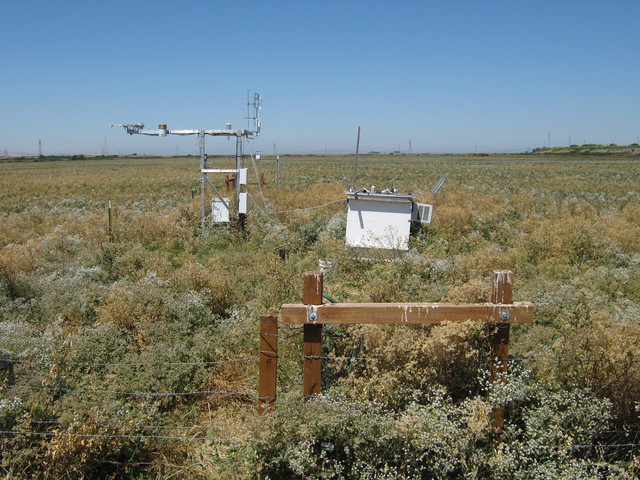
20100728SI_Site1.jpg ( 2010-07-28 12:02:58 ) Full size: 3648x2736
Sherman Island pasture eddy tower and box
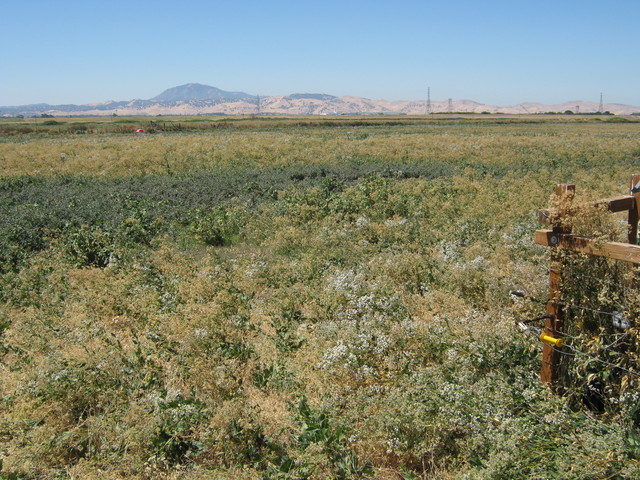
20100728SI_Site2.jpg ( 2010-07-28 12:03:28 ) Full size: 3648x2736
Mt Diablo from Sherman pasture
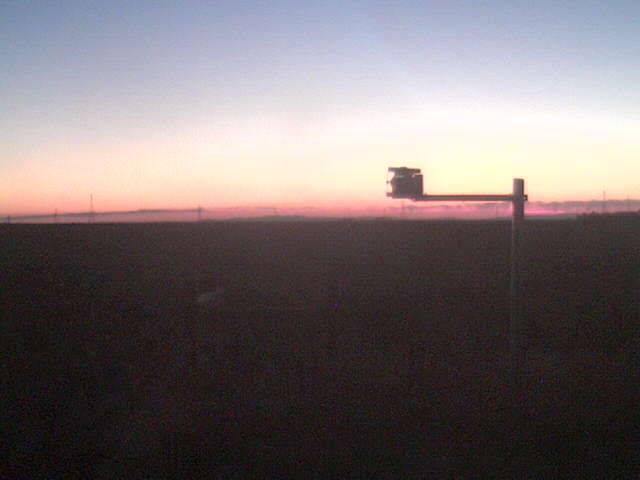
SI_webcam_20102081945.jpg ( 2010-07-27 19:45:02 ) Full size: 640x480
Nice sunset.
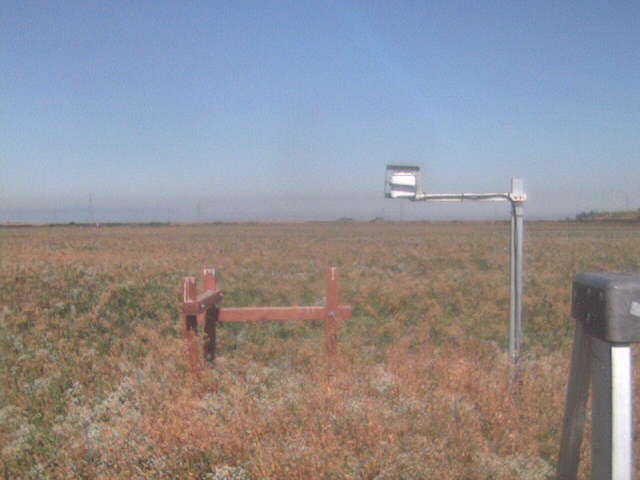
SI_webcam_20102090915.jpg ( 2010-07-28 09:15:02 ) Full size: 640x480
Ladder.
7 sets found
1 SI_mp graphs found
11 SI_met graphs found
Can't check SI_mixed
2 SI_mixed graphs found
5 SI_flx graphs found
2 SI_soilco2 graphs found
Can't check TWSI_mixed
Can't check SIMBTWEE_met

