
Field Notes
<--2010-10-01 07:30:00 | 2010-10-21 10:00:00-->Other sites visited today: Mayberry | Twitchell Rice
Phenocam link: Searching...
Sherman Island: 2010-10-14 13:00:00 (DOY 287)
Author: Joe Verfaillie
Others: Dennis, Jaclyn
Summary: Standard field work, pulled water pressure sensor.
| Sherman
10/14/2010 I arrived with Dennis and Jaclyn about 1pm after setting up the new Mayberry tower. Hot, sunny with a few high clouds and almost no wind. The field looks browner, but the west end was much wetter as viewed from the bridge. There was standing water and the ditches were wet. The cows were closer to the tower, probably avoiding the soggy west end. Systems are running okay. We are not running an LGR here right now. I could not connect to the fast radiation CR10x but it had transferred data to the PC earlier in the day. It had power and there were some earwigs in the box, but seemed okay. I copied data and showed Dennis how to swap the card on the CR1000. It maybe took too long to get the card punched out as the files needed to be repaired. Dennis pulled the water pressure sensor for a checkup in the lab before being redeployed at the new Mayberry site. |
2 photos found
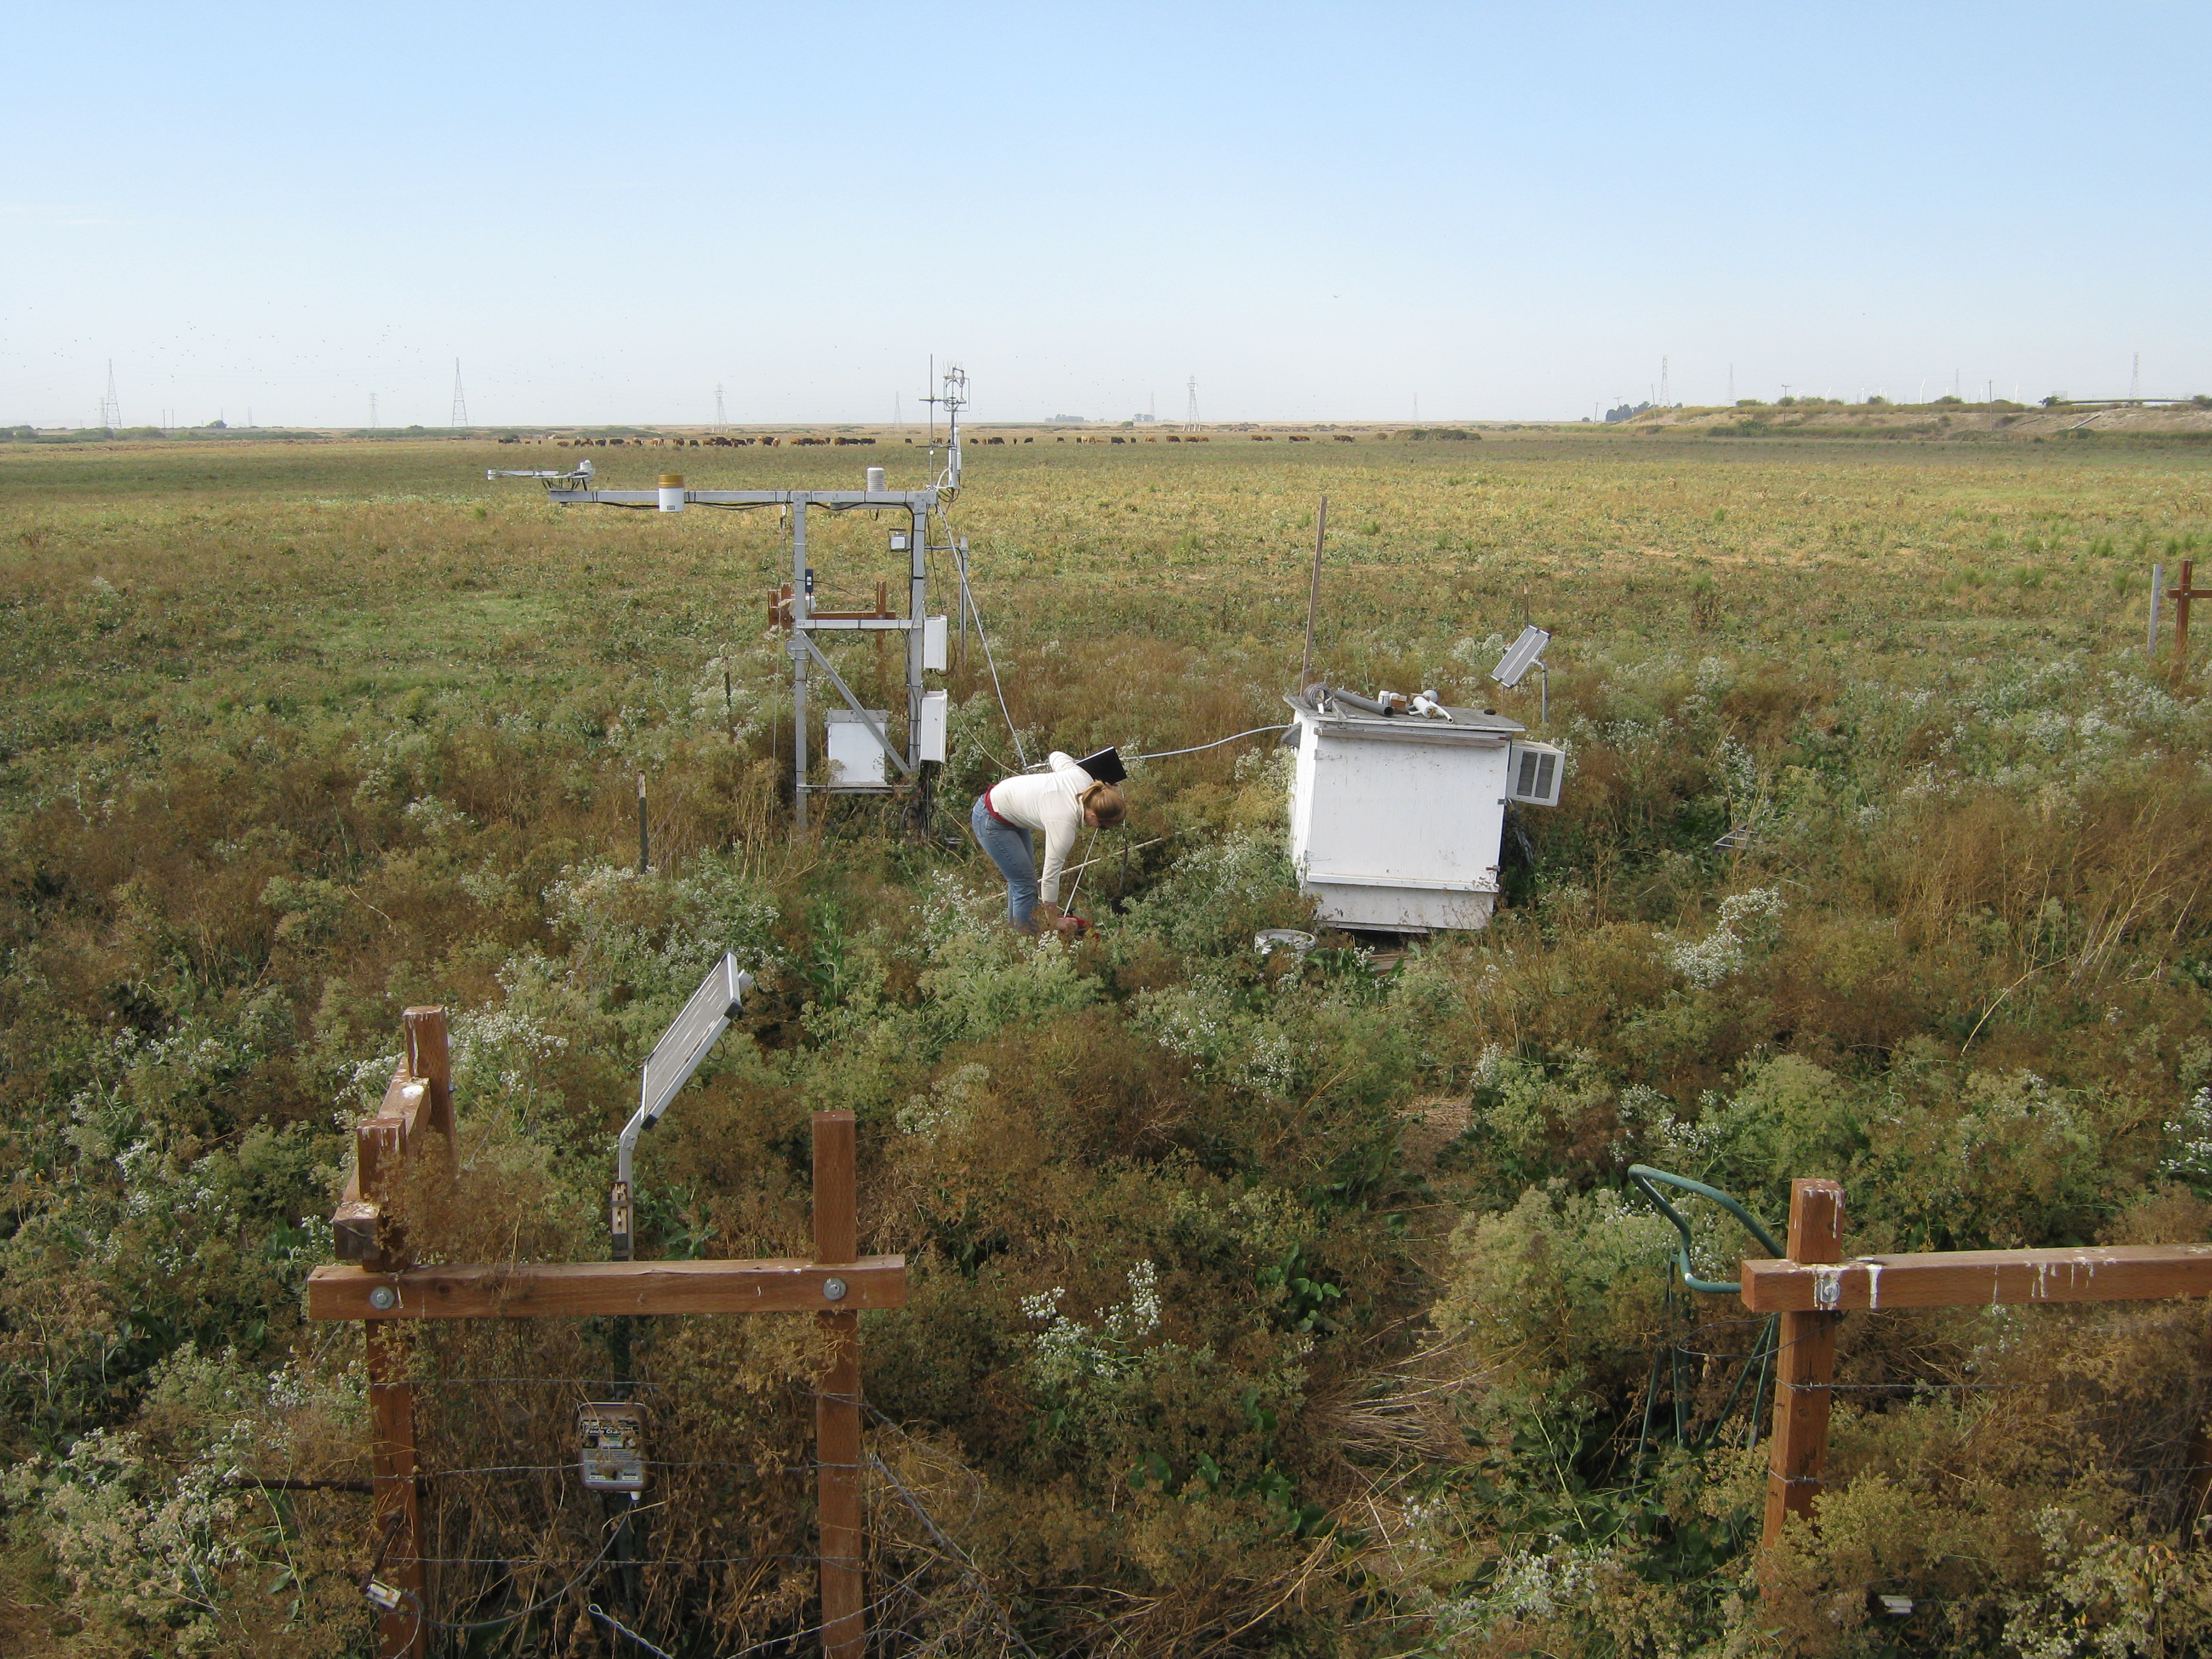
20101014SI_JaclynTower.jpg ( 2010-10-14 13:36:55 ) Full size: 3648x2736
Jaclyn at Sherman Pasture site
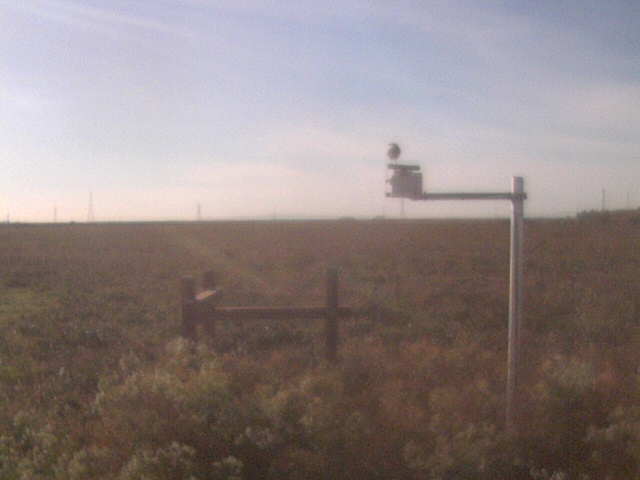
SI_webcam_20102881545.jpg ( 2010-10-15 14:45:02 ) Full size: 640x480
Bird on diffuse radiation shadow band.
7 sets found
1 SI_mp graphs found
11 SI_met graphs found
Can't check SI_mixed
2 SI_mixed graphs found
5 SI_flx graphs found
2 SI_soilco2 graphs found
Can't check TWSI_mixed
Can't check SIMBTWEE_met