Field Notes
<--2010-10-14 13:00:00 | 2010-10-27 09:30:00-->Other sites visited today: Mayberry
Phenocam link: Searching...
Sherman Island: 2010-10-21 10:00:00 (DOY 294)
Author: Joe Verfaillie
Others: Jaclyn
Summary: Problems with the computer, pulled for testing in the lab, collected data logger data manually.
| Sherman
10-21-2010 I arrived about 10am with Jaclyn. The pepper weed continues to decline and looks more and more trampled. The west end of the field still looks wet from the bridge but the tower area is still dry. The computer was hung up and I could not get it to reboot. I connected to each of the data loggers and downloaded all their internal data then pulled the computer. However, in the lab it booted up fine and showed that it had hung up in the afternoon of the 18th. It might be the power supply in the field, or it might be the KVM switch that no longer has the LGR connected to it. Jaclyn found the black widow in the soil CO2 box and I killed it. I did not swap the CR1000 card. |
5 photos found
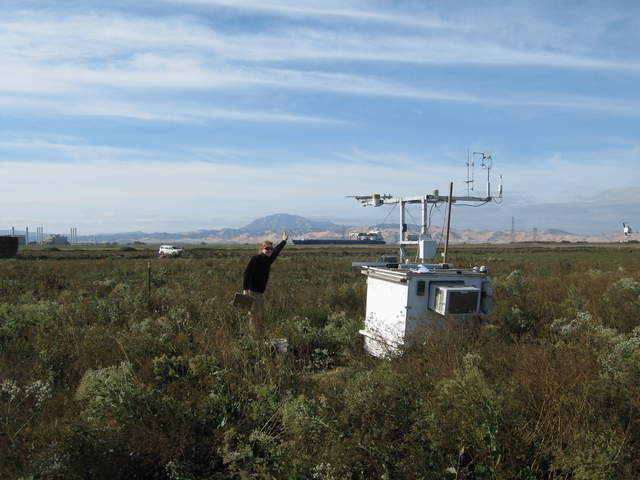
20101021SI_JaclynShip.jpg ( 2010-10-21 10:21:12 ) Full size: 3648x2736
Jaclyn reaching to the ship passing the eddy tower
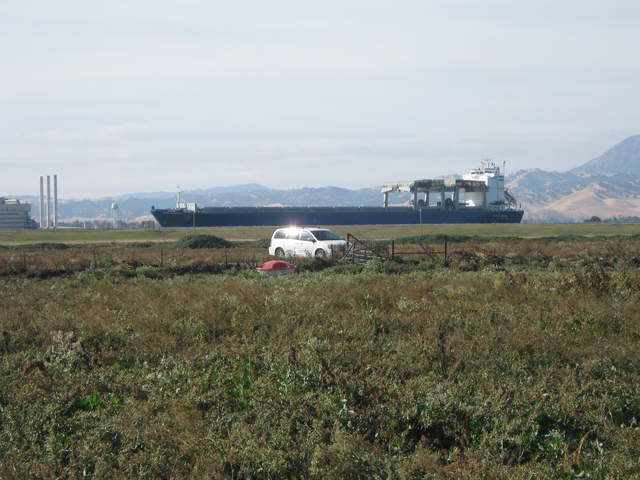
20101021SI_ShipAboveCar.jpg ( 2010-10-21 10:22:22 ) Full size: 3648x2736
Ship above car at the cow pasture
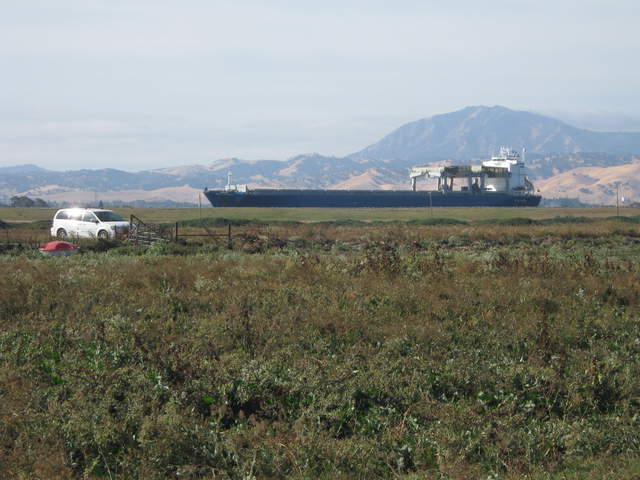
20101021SI_ShipDiablo.jpg ( 2010-10-21 10:21:51 ) Full size: 3648x2736
Ship passing above the cow pasture
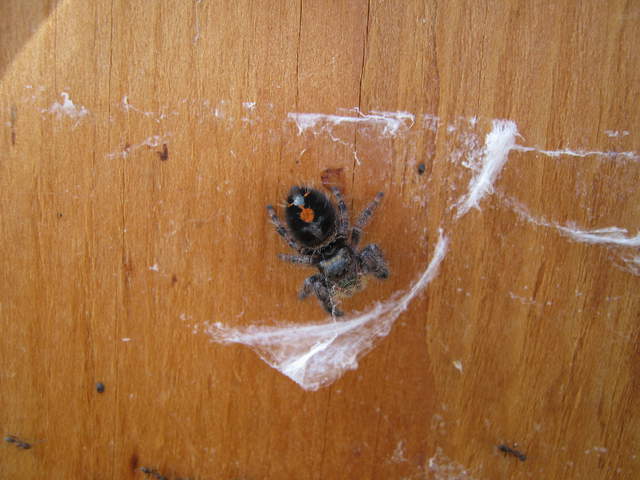
20101021SI_Spider.jpg ( 2010-10-21 10:23:10 ) Full size: 3648x2736
Jumping spider with orange dot
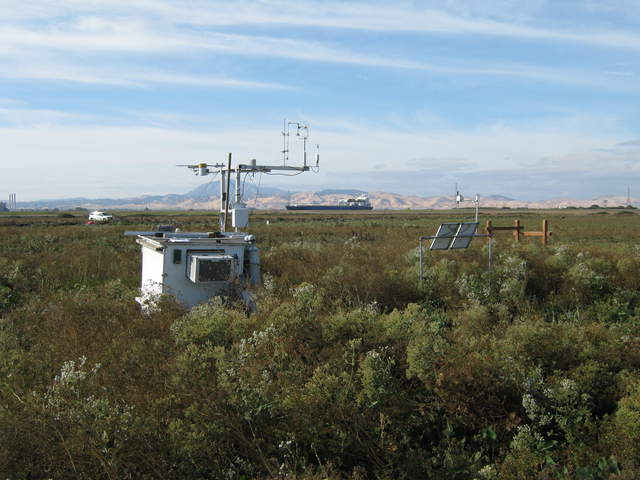
20101021SI_TowerShip.jpg ( 2010-10-21 10:20:50 ) Full size: 3648x2736
Eddy tower with ship in the background
7 sets found
1 SI_mp graphs found
11 SI_met graphs found
Can't check SI_mixed
2 SI_mixed graphs found
5 SI_flx graphs found
2 SI_soilco2 graphs found
Can't check TWSI_mixed
Can't check SIMBTWEE_met

