Field Notes
<--2019-02-28 16:25:00 | 2019-04-03 10:10:00-->Other sites visited today: Mayberry | West Pond | East End | East Pond | Sherman Wetland | Bouldin Corn | Sherman Barn
Phenocam link: Searching...
Bouldin Alfalfa: 2019-03-14 14:35:00 (DOY 73)
Author: Camilo Rey-Sanchez
Others: Daphne, Alex
Summary: Regular data collection and cleaning. Releveled sonic. Spectral and veg height measurements.
| 2019-03-14 Bouldin Alfalfa We arrived at 14:35. It was sunny and breezy, with clear skies, some cirrus clouds and a clear view of Mount Diablo. The dirt road North of the field was dry enough to drive on. Desiccated alfalfa but not right next to the tower. Maybe spraying or birds? Radiation boom was still bent toward the tower. We fixed it. Camilo releveled the sonic anemometer by putting two washers on the mount of the sonic. Alex measured vegetation height. Daphne tried to update the firmware in Li-7700 but there was an error: “Fatal: Network error: Connection timed outâ€. Alex took spectral measurements: files 24-33. Wash reservoir was ¾ full and we topped it off. Daphne downloaded met, camera, and USB GHG data. Camilo cleaned the flux and rad sensors and took reference GCC photo. Alex trimmed the alfalfa under the tower. PakBus address in the CR1000 sn 66252 changed from 1-->52 LI-7500 readings: CO2 412ppm H2O 274ppm T 17.3C P 102.4kPa SS 98--> 99 after cleaning LI7700 readings: CH4 2.0ppm RSSI 50--> 79 after cleaning We left at 15:15. |
Next Mowing: 2019-04-29
Veg Height (cm): Tape measure from ground to top of plant - Measured by Alex
17, 9, 12, 15, 13, 10, 9, 9, 7, 8, 6, 6, 8, 7, 4, 6, 5, 13, 7, 10, avg = 9.1, stdev = 3.44
1 photos found

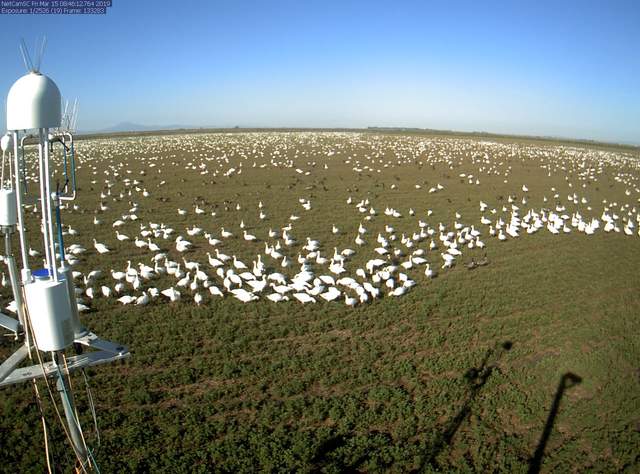
bouldinalfalfa_2019_03_15_084611.jpg ( 2019-03-15 08:51:30 ) Full size: 1296x960
Geese all over the field
7 sets found
5 BA_flux graphs found
21 BA_met graphs found
6 BA_arable graphs found
Can't check TATWBABCSB_cam
Can't check MBSWEEWPBCBA
2 BA_processed graphs found
No data found for BA_adex.

