
Field Notes
<--2018-10-30 11:00:00 | 2018-11-28 09:55:00-->Other sites visited today: Mayberry | Sherman Barn | West Pond | Bouldin Alfalfa | Bouldin Corn | East End | East Pond
Phenocam link: Searching...
Sherman Wetland: 2018-11-01 14:45:00 (DOY 305)
Author: Daphne Szutu
Others: Dennis, Kuno
Summary: Regular data collection/cleaning, downloaded miniDOT, replaced eosGP CO2 probe, 7700 clock sync error
| 2018-11-01 Sherman Wetland Dennis, Kuno, and I arrived at 14:45. It was sunny and breezy with thin clouds. It was dry under the tower. Wildlife report: spiderwebs everywhere, many bird sounds, and some otter poop in the spaces of the wooden lattice, but at least we can step on the lattice to avoid it. PG&E will be removing a transformer from a power pole NE of the tower, but it shouldn’t affect us. The water level was 52 cm. Kuno also measured the water level sensor inside the well: the sensor was 62cm below water level. Looking at the data back in the lab, the water level sensor was put back in a different place, about 32 cm higher than before. Kuno cleaned the flux and rad sensor. The wash reservoir was 1/5 empty; I refilled it. I downloaded met, camera, and USB GHG data. I added an eosGP CO2 probe (sn GP20140084). Kuno installed it by the 3rd post (same post as the miniDOT) in a shallow water pool. The previous CO2 probe was installed off of the 2nd post, but there’s no water there at the moment. There was a 7700 clock sync error that was not solved by the usual fix of resetting the 7550 box. I resolved the error by setting the 7700 clock from automatic to slave. I reset the 7550 box, and then couldn’t connect the 7550 software until I restarted the laptop. After finally connecting to the 7550, I confirmed that the 7700 was connected and that there were no clock sync errors. LI-7500 readings: CO2 411ppm H2O 580ppm T 27.1C P 101.9kPa SS 97-->98 after cleaning LI7700 readings: CH4 2.13ppm RSSI 57 --> 82 after cleaning We left at 15:35. |
1 photos found
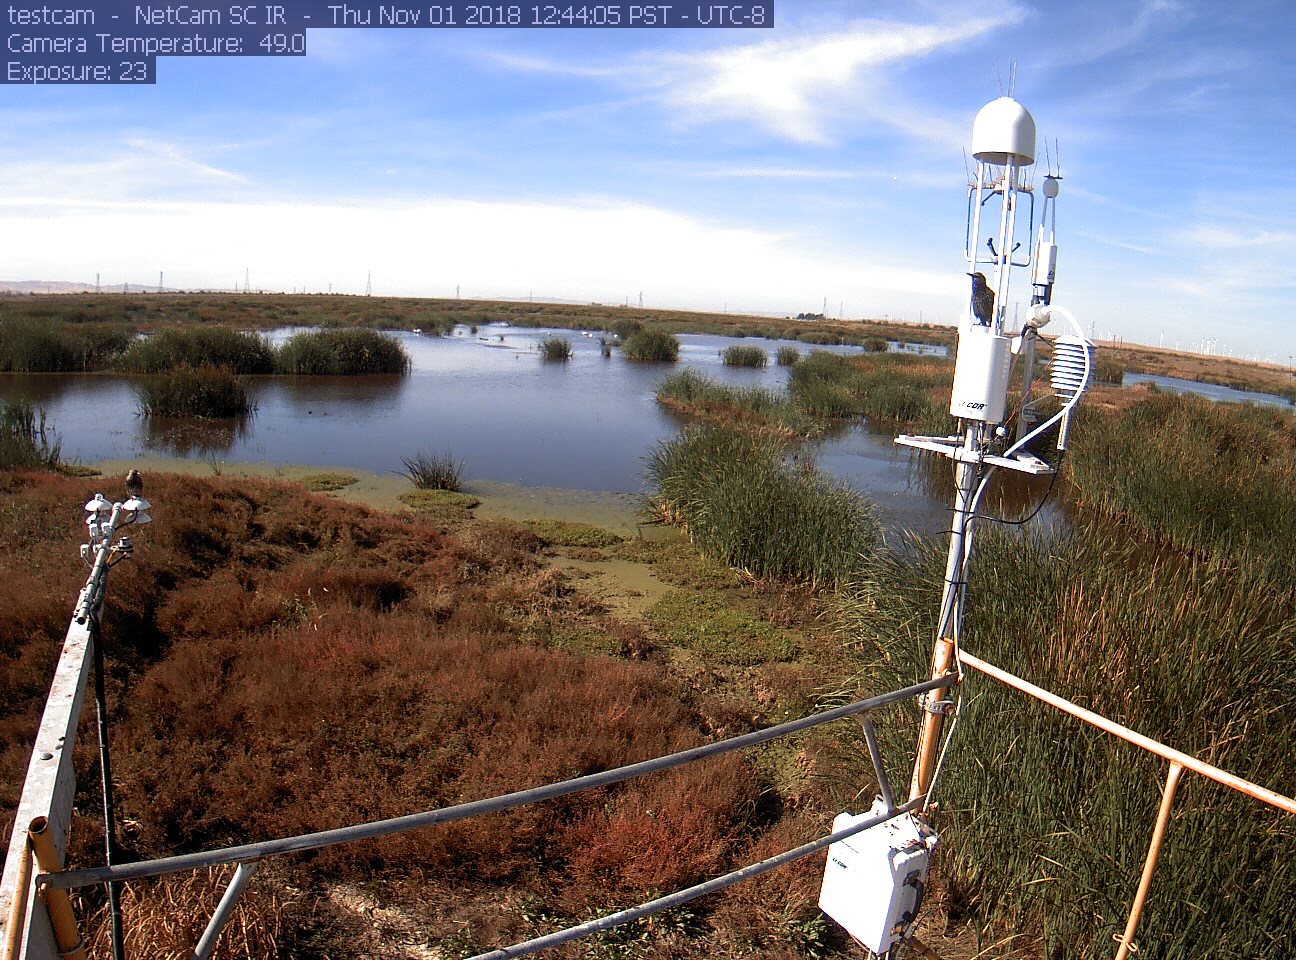
siwetland_2018_11_01_124405.jpg ( 2018-11-01 13:51:58 ) Full size: 1296x960
Bird in 7700 path
7 sets found
Can't check MBWPEESWGT_mixed
Can't check MBEEWPSWEPGT_cam
16 SW_met graphs found
4 SW_flux graphs found
Can't check MBSWEEWPBCBA
Can't check SW_Temp
14 SW_Temp graphs found
No data found for SW_arable.