
Field Notes
<--2018-06-26 10:30:00 | 2018-08-10 09:15:00-->Other sites visited today: Tonzi | East End
Phenocam link: Searching...
Vaira: 2018-07-18 12:00:00 (DOY 199)
Author: Siyan Ma
Others: Trevor Keenan
Summary: Regular fieldwork, very hot and sunny, fire scar to the east beyond the pond
| Here is a link to a news story about the fire near Vaira and Tonzi on July 6th. http://www.kcra.com/article/evacuations-remain-as-crews-stop-progress-of-amador-county-fire/22076863 Attached is a clip of a map from here: href='https://projects.sfchronicle.com/2018/fire-tracker/ I don't think they've got the map in the right place. Looks like two of the same shaped. If it was the one to the west then Tonzi would have burned. Siyan could see the burn scar from Vaira, but it was way to the east beyond the pond. |
Field Data
No tank data
Well Depth
| Date | Location | Depth (feet) |
|---|---|---|
| 2018-07-18 | TZ_road | 31.1 |
| 2018-07-18 | TZ_tower | 26.7 |
| 2018-07-18 | TZ_floor | 22.2 |
mode = both
Moisture Point Probes TZ
Array
(
[0] => Tower_1
[1] => Floor_South_1
[2] => Floor_West_1
[3] => Soil_Transect_4_1
[4] => Soil_Transect_3_1
[5] => Soil_Transect_2_1
[6] => Soil_Transect_1_1
[7] => SoilCO2_West_A_1
[8] => SoilCO2_West_B_1
[9] => SoilCO2_West_C_1
[10] => Tower_2
[11] => Floor_South_2
[12] => Floor_West_2
[13] => Soil_Transect_4_2
[14] => Soil_Transect_3_2
[15] => Soil_Transect_2_2
[16] => Soil_Transect_1_2
[17] => SoilCO2_West_A_2
[18] => SoilCO2_West_B_2
[19] => SoilCO2_West_C_2
[20] => Tower_3
[21] => Floor_South_3
[22] => Soil_Transect_4_3
[23] => Soil_Transect_3_3
[24] => Soil_Transect_2_3
[25] => Soil_Transect_1_3
[26] => SoilCO2_West_A_3
[27] => SoilCO2_West_B_3
[28] => SoilCO2_West_C_3
[29] => Tower_4
[30] => Floor_South_4
[31] => Soil_Transect_4_4
[32] => Soil_Transect_3_4
[33] => Soil_Transect_2_4
[34] => Soil_Transect_1_4
[35] => SoilCO2_West_A_4
[36] => SoilCO2_West_B_4
[37] => SoilCO2_West_C_4
[38] => Floor_West_3
[39] => Floor_West_4
)
| Date | DOY | Rep | Depth | Tower_1 |
Floor_South_1 |
Floor_West_1 |
Soil_Transect_4_1 |
Soil_Transect_3_1 |
Soil_Transect_2_1 |
Soil_Transect_1_1 |
SoilCO2_West_A_1 |
SoilCO2_West_B_1 |
SoilCO2_West_C_1 |
Tower_2 |
Floor_South_2 |
Floor_West_2 |
Soil_Transect_4_2 |
Soil_Transect_3_2 |
Soil_Transect_2_2 |
Soil_Transect_1_2 |
SoilCO2_West_A_2 |
SoilCO2_West_B_2 |
SoilCO2_West_C_2 |
Tower_3 |
Floor_South_3 |
Soil_Transect_4_3 |
Soil_Transect_3_3 |
Soil_Transect_2_3 |
Soil_Transect_1_3 |
SoilCO2_West_A_3 |
SoilCO2_West_B_3 |
SoilCO2_West_C_3 |
Tower_4 |
Floor_South_4 |
Soil_Transect_4_4 |
Soil_Transect_3_4 |
Soil_Transect_2_4 |
Soil_Transect_1_4 |
SoilCO2_West_A_4 |
SoilCO2_West_B_4 |
SoilCO2_West_C_4 |
Floor_West_3 |
Floor_West_4 |
Avg | Spacial Count |
Measurement Count |
|---|---|---|---|---|---|---|---|---|---|---|---|---|---|---|---|---|---|---|---|---|---|---|---|---|---|---|---|---|---|---|---|---|---|---|---|---|---|---|---|---|---|---|---|---|---|---|
| 2018-07-18 | 199 | 0 | nan | 3.9 | 0.1 | 5.3 | 1.6 | 2.7 | 3 | 0.6 | 5.3 | 9.4 | 1.8 | 12.4 | 10.6 | 7.8 | 8.7 | 14.8 | 12.4 | 4.5 | 9.3 | 0.8 | 12.1 | 14.8 | 11.7 | 9.5 | 15.6 | 16.8 | 14.3 | 18.4 | 15.1 | 12.6 | 17.9 | 3.3 | 11.9 | 18.8 | 27.9 | 12.5 | 19.8 | 20.8 | 25.1 | |||||
| 2018-07-18 | 199 | 1 | nan | 3.6 | 0.9 | 4.5 | 2.2 | 3 | 3 | 0.3 | 5 | 8.8 | 1.5 | 12.4 | 11.2 | 8.1 | 9.3 | 15.2 | 12.1 | 4.8 | 9 | 0.3 | 11.8 | 15.1 | 11.5 | 10.3 | 15.4 | 16.5 | 14.3 | 18.2 | 15.4 | 12.6 | 17.6 | 4.4 | 12.2 | 16.8 | 37.6 | 11.6 | 19.6 | 19.9 | 25.4 | 25.7 | 11.1 | |||
| 2018-07-18 | 199 | Avg | 0-15cm | 0 | 0 | |||||||||||||||||||||||||||||||||||||||||
| 2018-07-18 | 199 | Avg | 15-30cm | 0 | 0 | |||||||||||||||||||||||||||||||||||||||||
| 2018-07-18 | 199 | Avg | 30-45cm | 0 | 0 | |||||||||||||||||||||||||||||||||||||||||
| 2018-07-18 | 199 | Avg | 45-60cm | 0 | 0 |
mode = both
Moisture Point Probes VR
Array
(
[0] => Solar_Panels_1
[1] => Flux_Tower_1
[2] => Gate_1
[3] => Biomass_Cage_1
[4] => Solar_Panels_2
[5] => Flux_Tower_2
[6] => Gate_2
[7] => Biomass_Cage_2
[8] => Solar_Panels_3
[9] => Flux_Tower_3
[10] => Gate_3
[11] => Biomass_Cage_3
[12] => Solar_Panels_4
[13] => Flux_Tower_4
[14] => Gate_4
[15] => Biomass_Cage_4
)
| Date | DOY | Rep | Depth | Solar_Panels_1 |
Flux_Tower_1 |
Gate_1 |
Biomass_Cage_1 |
Solar_Panels_2 |
Flux_Tower_2 |
Gate_2 |
Biomass_Cage_2 |
Solar_Panels_3 |
Flux_Tower_3 |
Gate_3 |
Biomass_Cage_3 |
Solar_Panels_4 |
Flux_Tower_4 |
Gate_4 |
Biomass_Cage_4 |
Avg | Spacial Count |
Measurement Count |
|---|---|---|---|---|---|---|---|---|---|---|---|---|---|---|---|---|---|---|---|---|---|---|
| 2018-07-18 | 199 | 0 | nan | 0.9 | 0.7 | 7.1 | 1.2 | 9.7 | 8.4 | 5.4 | 6.3 | 15.1 | 4.8 | 7.8 | 16.5 | 29.4 | 15.9 | 20.5 | 20.5 | |||
| 2018-07-18 | 199 | 1 | nan | 0.9 | 1 | 6.8 | 0.6 | 9 | 8.4 | 5.1 | 6.3 | 14.8 | 5.6 | 7.8 | 17 | 28.7 | 15 | 20.5 | 20.5 | |||
| 2018-07-18 | 199 | Avg | 0-15cm | 0 | 0 | |||||||||||||||||
| 2018-07-18 | 199 | Avg | 15-30cm | 0 | 0 | |||||||||||||||||
| 2018-07-18 | 199 | Avg | 30-45cm | 0 | 0 | |||||||||||||||||
| 2018-07-18 | 199 | Avg | 45-60cm | 0 | 0 |
No TZ grass heigth found
No VR grass heigth found
No VR Tree DBH found
No water potential data found
No VR Grass Biomass data found
No VR OakLeaves Biomass data found
No VR PineNeedles Biomass data found
2 photos found
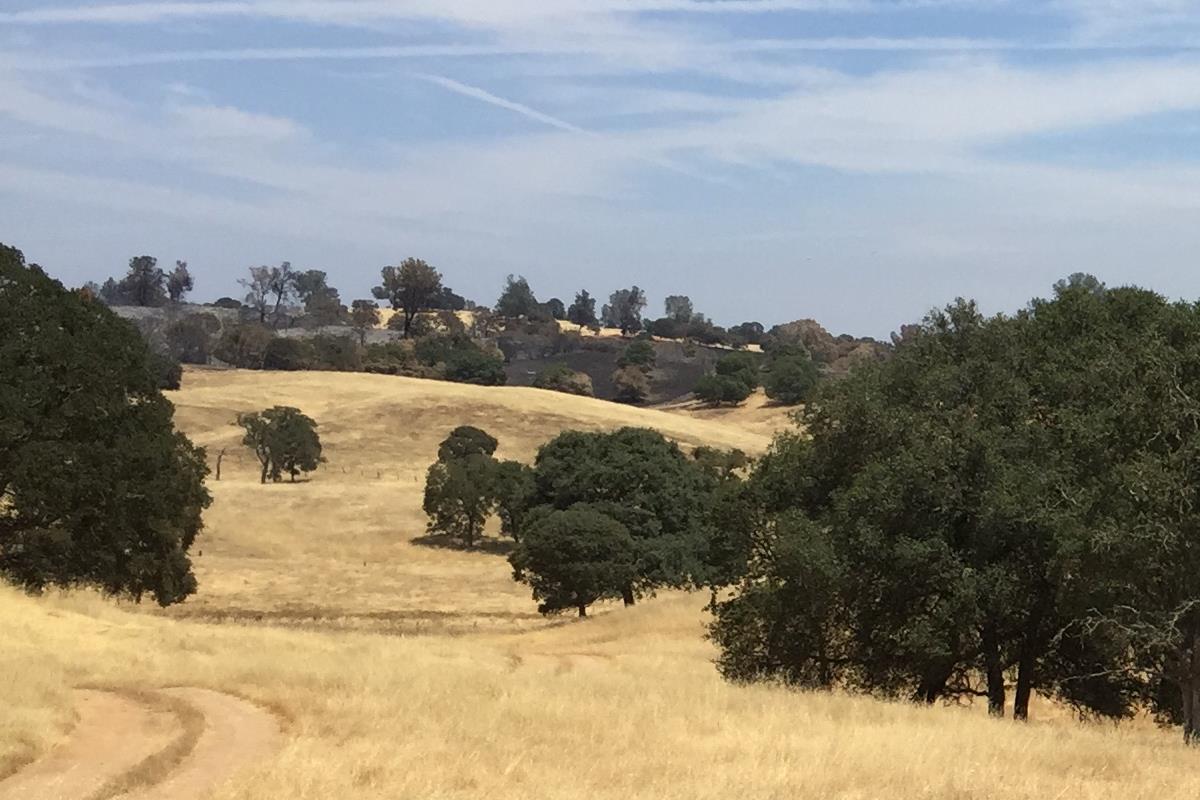
20180718VR_BurnNorthOfPond.jpg ( 2018-07-18 12:51:36 ) Full size: 1200x800
Irish Fire on July 6th, 2018 burned north and east of the pond at Varia.

20180718VR_BurnEastOfPond.jpg ( 2018-07-18 00:00:00 ) Full size: 1200x800
Irish Fire on July 6th, 2018 burned north and east of the pond at
9 sets found
16 VR_met graphs found
2 VR_flux graphs found
6 VR_soilco2 graphs found
2 VR_pond graphs found
Can't check TZVR_mixed
No data found for VR_fd.
No data found for VR_processed.
No data found for VR_arable.
No data found for VR_soilvue.