
Field Notes
<--2018-06-26 11:30:00 | 2018-08-10 09:00:00-->Other sites visited today: Vaira | East End
Phenocam link: Searching...
Tonzi: 2018-07-18 09:10:00 (DOY 199)
Author: Joe Verfaillie
Others: Siyan, Ana, Trevor Keenan, JPL
Summary: Met JPL to plan radiometer install, Moved FLIR camera and black panel.
| Tonzi 2018-07-18 I arrived at about 9:10 with Siyan, Ana and Trevor Keenan. It was super-hot and sunny with a very few high thin clouds and a nice breeze for most of the day. The pond has receded quite a bit. At the gate we met Gerardo Rivera and Lin Kroll and later their safety adviser from JPL. Lin and Gerardo made measurements for solar panels and cable runs for installing their radiometer later. They also installed an enclosure on the northeast corner of the tower a little over half way up. Rob Conkling brought in their safety adviser and was real concerned about fire dangers. There had been a recent burn over near the Vaira site. We left all the fence chargers off on our way out. Not much info on what JPL will be putting on the tower. Here's what I have gleaned: https://calval.jpl.nasa.gov/radiometers I think they are putting on two thermal radiometers measuring 8-14 micrometers. One will look at shaded areas and the other at sunlight areas. They will be used for ground truthing the EcoStress satellite data. The radiometers will be looking to the south of the tower. They will put two solar panels and four batteries on the ground to the west of the tower. Ana and I moved Miriam’s FLIR camera from its location near the Floor tower to a position on the northwest corner of the tower just below the tower top data logger box. The camera is getting 24V power from the existing line in the data logger box and its Ethernet is plugged into the switch inside the box. The Latte Panda in is in the computer box at the base of the tower. The 24V line there is stepped down to 12V for the screen and the thermostat controlled fan. Another DC-DC converter takes the 24V and supplies two USB-A power ports, one of which is used to power the Latte Panda. It was all working when we left. We also moved the black panel and IRT with CR10x over to just south of the road. This puts it currently in the bottom left corner on the FLIR FOV. We might have to make the board bigger. Ana downloaded the OSU data. The radio links are only 9600 baud so getting the data from the two remote CR1000s took a really long time. Might be better to setup a computer to there to continuously collect that data. Or add another radio at the tower. Siyan did the standard field work including collecting most of the data then went to Vaira with Trevor around lunch time. They returned at 1pm to do midday water potential. We forgot to service the z-cam cameras – they should be okay until next time. JPL left just after 12noon. We left at about 2pm. |
Field Data
No tank data
Well Depth
| Date | Location | Depth (feet) |
|---|---|---|
| 2018-07-18 | TZ_road | 31.1 |
| 2018-07-18 | TZ_tower | 26.7 |
| 2018-07-18 | TZ_floor | 22.2 |
mode = both
Moisture Point Probes TZ
Array
(
[0] => Tower_1
[1] => Floor_South_1
[2] => Floor_West_1
[3] => Soil_Transect_4_1
[4] => Soil_Transect_3_1
[5] => Soil_Transect_2_1
[6] => Soil_Transect_1_1
[7] => SoilCO2_West_A_1
[8] => SoilCO2_West_B_1
[9] => SoilCO2_West_C_1
[10] => Tower_2
[11] => Floor_South_2
[12] => Floor_West_2
[13] => Soil_Transect_4_2
[14] => Soil_Transect_3_2
[15] => Soil_Transect_2_2
[16] => Soil_Transect_1_2
[17] => SoilCO2_West_A_2
[18] => SoilCO2_West_B_2
[19] => SoilCO2_West_C_2
[20] => Tower_3
[21] => Floor_South_3
[22] => Soil_Transect_4_3
[23] => Soil_Transect_3_3
[24] => Soil_Transect_2_3
[25] => Soil_Transect_1_3
[26] => SoilCO2_West_A_3
[27] => SoilCO2_West_B_3
[28] => SoilCO2_West_C_3
[29] => Tower_4
[30] => Floor_South_4
[31] => Soil_Transect_4_4
[32] => Soil_Transect_3_4
[33] => Soil_Transect_2_4
[34] => Soil_Transect_1_4
[35] => SoilCO2_West_A_4
[36] => SoilCO2_West_B_4
[37] => SoilCO2_West_C_4
[38] => Floor_West_3
[39] => Floor_West_4
)
| Date | DOY | Rep | Depth | Tower_1 |
Floor_South_1 |
Floor_West_1 |
Soil_Transect_4_1 |
Soil_Transect_3_1 |
Soil_Transect_2_1 |
Soil_Transect_1_1 |
SoilCO2_West_A_1 |
SoilCO2_West_B_1 |
SoilCO2_West_C_1 |
Tower_2 |
Floor_South_2 |
Floor_West_2 |
Soil_Transect_4_2 |
Soil_Transect_3_2 |
Soil_Transect_2_2 |
Soil_Transect_1_2 |
SoilCO2_West_A_2 |
SoilCO2_West_B_2 |
SoilCO2_West_C_2 |
Tower_3 |
Floor_South_3 |
Soil_Transect_4_3 |
Soil_Transect_3_3 |
Soil_Transect_2_3 |
Soil_Transect_1_3 |
SoilCO2_West_A_3 |
SoilCO2_West_B_3 |
SoilCO2_West_C_3 |
Tower_4 |
Floor_South_4 |
Soil_Transect_4_4 |
Soil_Transect_3_4 |
Soil_Transect_2_4 |
Soil_Transect_1_4 |
SoilCO2_West_A_4 |
SoilCO2_West_B_4 |
SoilCO2_West_C_4 |
Floor_West_3 |
Floor_West_4 |
Avg | Spacial Count |
Measurement Count |
|---|---|---|---|---|---|---|---|---|---|---|---|---|---|---|---|---|---|---|---|---|---|---|---|---|---|---|---|---|---|---|---|---|---|---|---|---|---|---|---|---|---|---|---|---|---|---|
| 2018-07-18 | 199 | 0 | nan | 3.9 | 0.1 | 5.3 | 1.6 | 2.7 | 3 | 0.6 | 5.3 | 9.4 | 1.8 | 12.4 | 10.6 | 7.8 | 8.7 | 14.8 | 12.4 | 4.5 | 9.3 | 0.8 | 12.1 | 14.8 | 11.7 | 9.5 | 15.6 | 16.8 | 14.3 | 18.4 | 15.1 | 12.6 | 17.9 | 3.3 | 11.9 | 18.8 | 27.9 | 12.5 | 19.8 | 20.8 | 25.1 | |||||
| 2018-07-18 | 199 | 1 | nan | 3.6 | 0.9 | 4.5 | 2.2 | 3 | 3 | 0.3 | 5 | 8.8 | 1.5 | 12.4 | 11.2 | 8.1 | 9.3 | 15.2 | 12.1 | 4.8 | 9 | 0.3 | 11.8 | 15.1 | 11.5 | 10.3 | 15.4 | 16.5 | 14.3 | 18.2 | 15.4 | 12.6 | 17.6 | 4.4 | 12.2 | 16.8 | 37.6 | 11.6 | 19.6 | 19.9 | 25.4 | 25.7 | 11.1 | |||
| 2018-07-18 | 199 | Avg | 0-15cm | 0 | 0 | |||||||||||||||||||||||||||||||||||||||||
| 2018-07-18 | 199 | Avg | 15-30cm | 0 | 0 | |||||||||||||||||||||||||||||||||||||||||
| 2018-07-18 | 199 | Avg | 30-45cm | 0 | 0 | |||||||||||||||||||||||||||||||||||||||||
| 2018-07-18 | 199 | Avg | 45-60cm | 0 | 0 |
mode = both
Moisture Point Probes VR
Array
(
[0] => Solar_Panels_1
[1] => Flux_Tower_1
[2] => Gate_1
[3] => Biomass_Cage_1
[4] => Solar_Panels_2
[5] => Flux_Tower_2
[6] => Gate_2
[7] => Biomass_Cage_2
[8] => Solar_Panels_3
[9] => Flux_Tower_3
[10] => Gate_3
[11] => Biomass_Cage_3
[12] => Solar_Panels_4
[13] => Flux_Tower_4
[14] => Gate_4
[15] => Biomass_Cage_4
)
| Date | DOY | Rep | Depth | Solar_Panels_1 |
Flux_Tower_1 |
Gate_1 |
Biomass_Cage_1 |
Solar_Panels_2 |
Flux_Tower_2 |
Gate_2 |
Biomass_Cage_2 |
Solar_Panels_3 |
Flux_Tower_3 |
Gate_3 |
Biomass_Cage_3 |
Solar_Panels_4 |
Flux_Tower_4 |
Gate_4 |
Biomass_Cage_4 |
Avg | Spacial Count |
Measurement Count |
|---|---|---|---|---|---|---|---|---|---|---|---|---|---|---|---|---|---|---|---|---|---|---|
| 2018-07-18 | 199 | 0 | nan | 0.9 | 0.7 | 7.1 | 1.2 | 9.7 | 8.4 | 5.4 | 6.3 | 15.1 | 4.8 | 7.8 | 16.5 | 29.4 | 15.9 | 20.5 | 20.5 | |||
| 2018-07-18 | 199 | 1 | nan | 0.9 | 1 | 6.8 | 0.6 | 9 | 8.4 | 5.1 | 6.3 | 14.8 | 5.6 | 7.8 | 17 | 28.7 | 15 | 20.5 | 20.5 | |||
| 2018-07-18 | 199 | Avg | 0-15cm | 0 | 0 | |||||||||||||||||
| 2018-07-18 | 199 | Avg | 15-30cm | 0 | 0 | |||||||||||||||||
| 2018-07-18 | 199 | Avg | 30-45cm | 0 | 0 | |||||||||||||||||
| 2018-07-18 | 199 | Avg | 45-60cm | 0 | 0 |
No TZ grass heigth found
No VR grass heigth found
Tree DBH
| Date | Tag# | Reading (mm) |
|---|---|---|
| 2018-07-18 | 102 | 10.8 |
| 2018-07-18 | 2 | 22.0 |
| 2018-07-18 | 245 | 8.8 |
| 2018-07-18 | 3 | 13.6 |
| 2018-07-18 | 4 | 9.2 |
| 2018-07-18 | 5 | 7.8 |
| 2018-07-18 | 7 | 21.3 |
| 2018-07-18 | 72 | 15.4 |
| 2018-07-18 | 79 | 12.6 |
| 2018-07-18 | 8 | 24.0 |
Water Potential - mode: raw
| Time | Species | Tree | readings (bar) | ||
|---|---|---|---|---|---|
| 2018-07-18 13:15:00 | OAK | 102 | -19 | -31 | -21 |
| 2018-07-18 13:15:00 | OAK | 35 | -21 | -22 | -31 |
| 2018-07-18 13:15:00 | OAK | 92 | -33 | -31 | -20 |
| 2018-07-18 13:47:00 | PINE | OLD | -13 | -15 | -1 |
| 2018-07-18 13:47:00 | PINE | YNG | -1 | -7 | -3 |
No TZ Grass Biomass data found
No TZ OakLeaves Biomass data found
No TZ PineNeedles Biomass data found
1 photos found
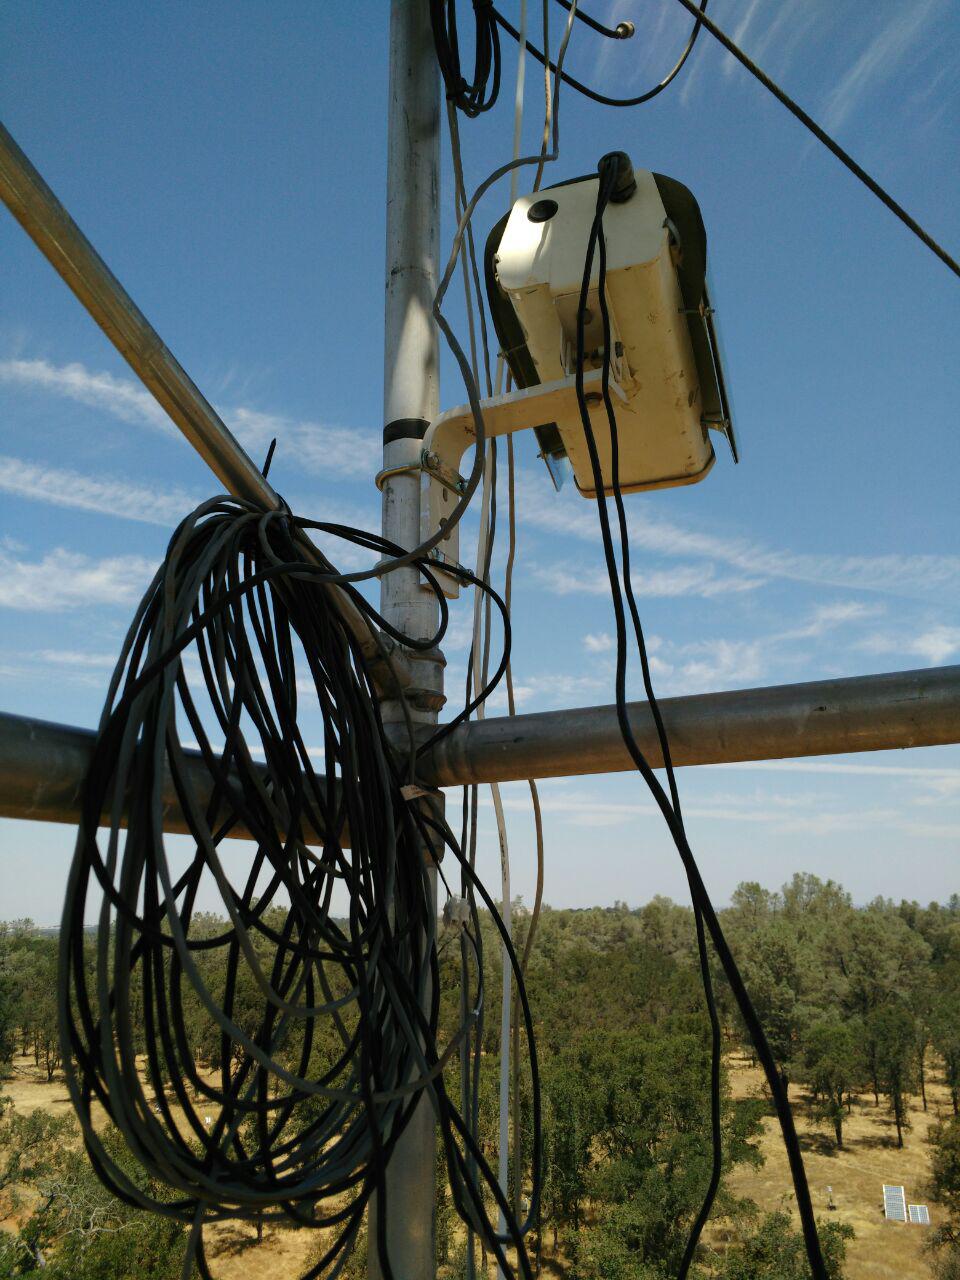
20180718TZ_NewFLIRMount.jpg ( 2018-07-18 12:15:02 ) Full size: 960x1280
The FLIR camera is now mounted near the top of the tower.
16 sets found
No data found for TZ_Fenergy.
11 TZ_tmet graphs found
11 TZ_soilco2 graphs found
Can't check TZ_mixed
3 TZ_mixed graphs found
1 TZ_fflux graphs found
8 TZ_fmet graphs found
No data found for TZ_tram.
3 TZ_co2prof graphs found
1 TZ_irt graphs found
No data found for TZ_windprof.
1 TZ_tflux graphs found
2 TZ_sm graphs found
Can't check TZ_met
1 TZ_met graphs found
Can't check TZVR_mixed
8 TZ_osu graphs found
No data found for TZ_fd.
Tonzi Z-cam data