
Field Notes
<--2018-06-05 10:00:00 | 2018-07-18 12:00:00-->Other sites visited today: Tonzi
Phenocam link: Searching...
Vaira: 2018-06-26 10:30:00 (DOY 177)
Author: Joe Verfaillie
Others: Siyan, Dennis, Ana
Summary: Swapped 7500s, standard data collection, went to the pond, too few phenocam images
| Vaira 2018-06-26 I arrived at about 10:30 with Siyan, Dennis and Ana. It was hot and sunny with little to no wind. The grass is golden, the trees are green. There is some water in the water hole near the road. I swapped the 7500: sn 75H-2182 off and sn 1594 on sn 2182 read: 406.8ppm CO2, 467.9mmol/m3 H2O, 27.3C, 99.4kPa, 84.8SS sn 1594 read: 414.6ppm CO2, 418.9mmol/m3 H2O, 27.4C, 99.4kPa, 99.9SS I collected the met data. The Phenocam only collected 127 images (why 127?) again. I put in the old SanDisk card that worked last time. I change the ftp timeout from 500 to 1000 in the Stardot scripts, but forgot to save the config. It should work until the camera restarts. Dennis did the soil moisture and Siyan did spectral measurements. We went to the pond. The top of the third staff gauge is just peeking out of the water. 17.02ft was the reading. |
Field Data
No tank data
Well Depth
| Date | Location | Depth (feet) |
|---|---|---|
| 2018-06-26 | TZ_road | 29.1 |
| 2018-06-26 | TZ_tower | 24.6 |
| 2018-06-26 | TZ_floor | 20.1 |
| 2018-06-26 | VR_pond | 17.02 |
mode = both
Moisture Point Probes TZ
Array
(
[0] => Tower_1
[1] => Floor_South_1
[2] => Floor_West_1
[3] => Soil_Transect_4_1
[4] => Soil_Transect_3_1
[5] => Soil_Transect_2_1
[6] => Soil_Transect_1_1
[7] => SoilCO2_West_A_1
[8] => SoilCO2_West_B_1
[9] => SoilCO2_West_C_1
[10] => Tower_2
[11] => Floor_South_2
[12] => Floor_West_2
[13] => Soil_Transect_4_2
[14] => Soil_Transect_3_2
[15] => Soil_Transect_2_2
[16] => Soil_Transect_1_2
[17] => SoilCO2_West_A_2
[18] => SoilCO2_West_B_2
[19] => SoilCO2_West_C_2
[20] => Tower_3
[21] => Floor_South_3
[22] => Floor_West_3
[23] => Soil_Transect_4_3
[24] => Soil_Transect_3_3
[25] => Soil_Transect_2_3
[26] => Soil_Transect_1_3
[27] => SoilCO2_West_A_3
[28] => SoilCO2_West_B_3
[29] => SoilCO2_West_C_3
[30] => Tower_4
[31] => Floor_South_4
[32] => Soil_Transect_4_4
[33] => Soil_Transect_3_4
[34] => Soil_Transect_2_4
[35] => Soil_Transect_1_4
[36] => SoilCO2_West_A_4
[37] => SoilCO2_West_B_4
[38] => SoilCO2_West_C_4
[39] => Floor_West_4
)
| Date | DOY | Rep | Depth | Tower_1 |
Floor_South_1 |
Floor_West_1 |
Soil_Transect_4_1 |
Soil_Transect_3_1 |
Soil_Transect_2_1 |
Soil_Transect_1_1 |
SoilCO2_West_A_1 |
SoilCO2_West_B_1 |
SoilCO2_West_C_1 |
Tower_2 |
Floor_South_2 |
Floor_West_2 |
Soil_Transect_4_2 |
Soil_Transect_3_2 |
Soil_Transect_2_2 |
Soil_Transect_1_2 |
SoilCO2_West_A_2 |
SoilCO2_West_B_2 |
SoilCO2_West_C_2 |
Tower_3 |
Floor_South_3 |
Floor_West_3 |
Soil_Transect_4_3 |
Soil_Transect_3_3 |
Soil_Transect_2_3 |
Soil_Transect_1_3 |
SoilCO2_West_A_3 |
SoilCO2_West_B_3 |
SoilCO2_West_C_3 |
Tower_4 |
Floor_South_4 |
Soil_Transect_4_4 |
Soil_Transect_3_4 |
Soil_Transect_2_4 |
Soil_Transect_1_4 |
SoilCO2_West_A_4 |
SoilCO2_West_B_4 |
SoilCO2_West_C_4 |
Floor_West_4 |
Avg | Spacial Count |
Measurement Count |
|---|---|---|---|---|---|---|---|---|---|---|---|---|---|---|---|---|---|---|---|---|---|---|---|---|---|---|---|---|---|---|---|---|---|---|---|---|---|---|---|---|---|---|---|---|---|---|
| 2018-06-26 | 177 | 0 | nan | 4.7 | 0.1 | 5.6 | 1.3 | 3.6 | 4.5 | 0.1 | 9.4 | 4.7 | 3 | 12.4 | 10.3 | 6.8 | 9.3 | 15.5 | 12.7 | 5.1 | 9 | 0.5 | 12.4 | 14.8 | 12.6 | 27.4 | 9.8 | 15.6 | 17.6 | 14 | 17.3 | 15.6 | 12.9 | 19.3 | 4.7 | 12.8 | 17.3 | 28.2 | 12.5 | 19.3 | 19.9 | 24.2 | ||||
| 2018-06-26 | 177 | 1 | nan | 5 | 0.7 | 6.5 | 2.2 | 2.1 | 4.2 | 0.3 | 10 | 5 | 3 | 11.8 | 10.9 | 6 | 9.3 | 15.2 | 12.7 | 4.2 | 9.3 | 0.2 | 12.1 | 15.1 | 12.9 | 39.6 | 9.2 | 14.8 | 17.6 | 14.5 | 17.3 | 15.6 | 12.9 | 19.3 | 4.7 | 12.5 | 18.2 | 28.8 | 12.8 | 19.6 | 19.6 | 23.9 | 11.1 | |||
| 2018-06-26 | 177 | 2 | nan | 5.3 | 0.4 | 0 | 2.2 | 4.2 | 4.2 | 0.3 | 9.4 | 4.7 | 3.3 | 11.5 | 10 | 11.1 | 9.3 | 15.2 | 12.7 | 4.8 | 9.3 | 0.2 | 11.8 | 14.5 | 13.1 | 5.7 | 10.1 | 15.4 | 17.3 | 14.5 | 17 | 15.4 | 13.4 | 18.2 | 5 | 12.2 | 17.3 | 27.9 | 12.5 | 19.9 | 19.1 | 24.2 | 28.2 | |||
| 2018-06-26 | 177 | Avg | 0-15cm | 0 | 0 | |||||||||||||||||||||||||||||||||||||||||
| 2018-06-26 | 177 | Avg | 15-30cm | 0 | 0 | |||||||||||||||||||||||||||||||||||||||||
| 2018-06-26 | 177 | Avg | 30-45cm | 0 | 0 | |||||||||||||||||||||||||||||||||||||||||
| 2018-06-26 | 177 | Avg | 45-60cm | 0 | 0 |
mode = both
Moisture Point Probes VR
Array
(
[0] => Solar_Panels_1
[1] => Gate_1
[2] => Biomass_Cage_1
[3] => Solar_Panels_2
[4] => Flux_Tower_2
[5] => Biomass_Cage_2
[6] => Solar_Panels_3
[7] => Flux_Tower_3
[8] => Biomass_Cage_3
[9] => Solar_Panels_4
[10] => Flux_Tower_4
[11] => Biomass_Cage_4
[12] => Flux_Tower_1
)
| Date | DOY | Rep | Depth | Solar_Panels_1 |
Gate_1 |
Biomass_Cage_1 |
Solar_Panels_2 |
Flux_Tower_2 |
Biomass_Cage_2 |
Solar_Panels_3 |
Flux_Tower_3 |
Biomass_Cage_3 |
Solar_Panels_4 |
Flux_Tower_4 |
Biomass_Cage_4 |
Flux_Tower_1 |
Avg | Spacial Count |
Measurement Count |
|---|---|---|---|---|---|---|---|---|---|---|---|---|---|---|---|---|---|---|---|
| 2018-06-26 | 177 | 0 | nan | 4.5 | 15.3 | 1.2 | 9 | 8.4 | 6.5 | 13.7 | 5.6 | 17 | 27.5 | 15 | 19.6 | ||||
| 2018-06-26 | 177 | 1 | nan | 3.6 | 17.3 | 1.5 | 8.7 | 8.7 | 6.3 | 13.4 | 4.5 | 17.3 | 27.9 | 15 | 19.3 | ||||
| 2018-06-26 | 177 | 2 | nan | 3.9 | 1.6 | 9 | 9 | 6.3 | 14.3 | 4.5 | 17.3 | 27.5 | 14.5 | 19.3 | 0.4 | ||||
| 2018-06-26 | 177 | Avg | 0-15cm | 0 | 0 | ||||||||||||||
| 2018-06-26 | 177 | Avg | 15-30cm | 0 | 0 | ||||||||||||||
| 2018-06-26 | 177 | Avg | 30-45cm | 0 | 0 | ||||||||||||||
| 2018-06-26 | 177 | Avg | 45-60cm | 0 | 0 |
No TZ grass heigth found
No VR grass heigth found
No VR Tree DBH found
No water potential data found
No VR Grass Biomass data found
No VR OakLeaves Biomass data found
No VR PineNeedles Biomass data found
1 photos found
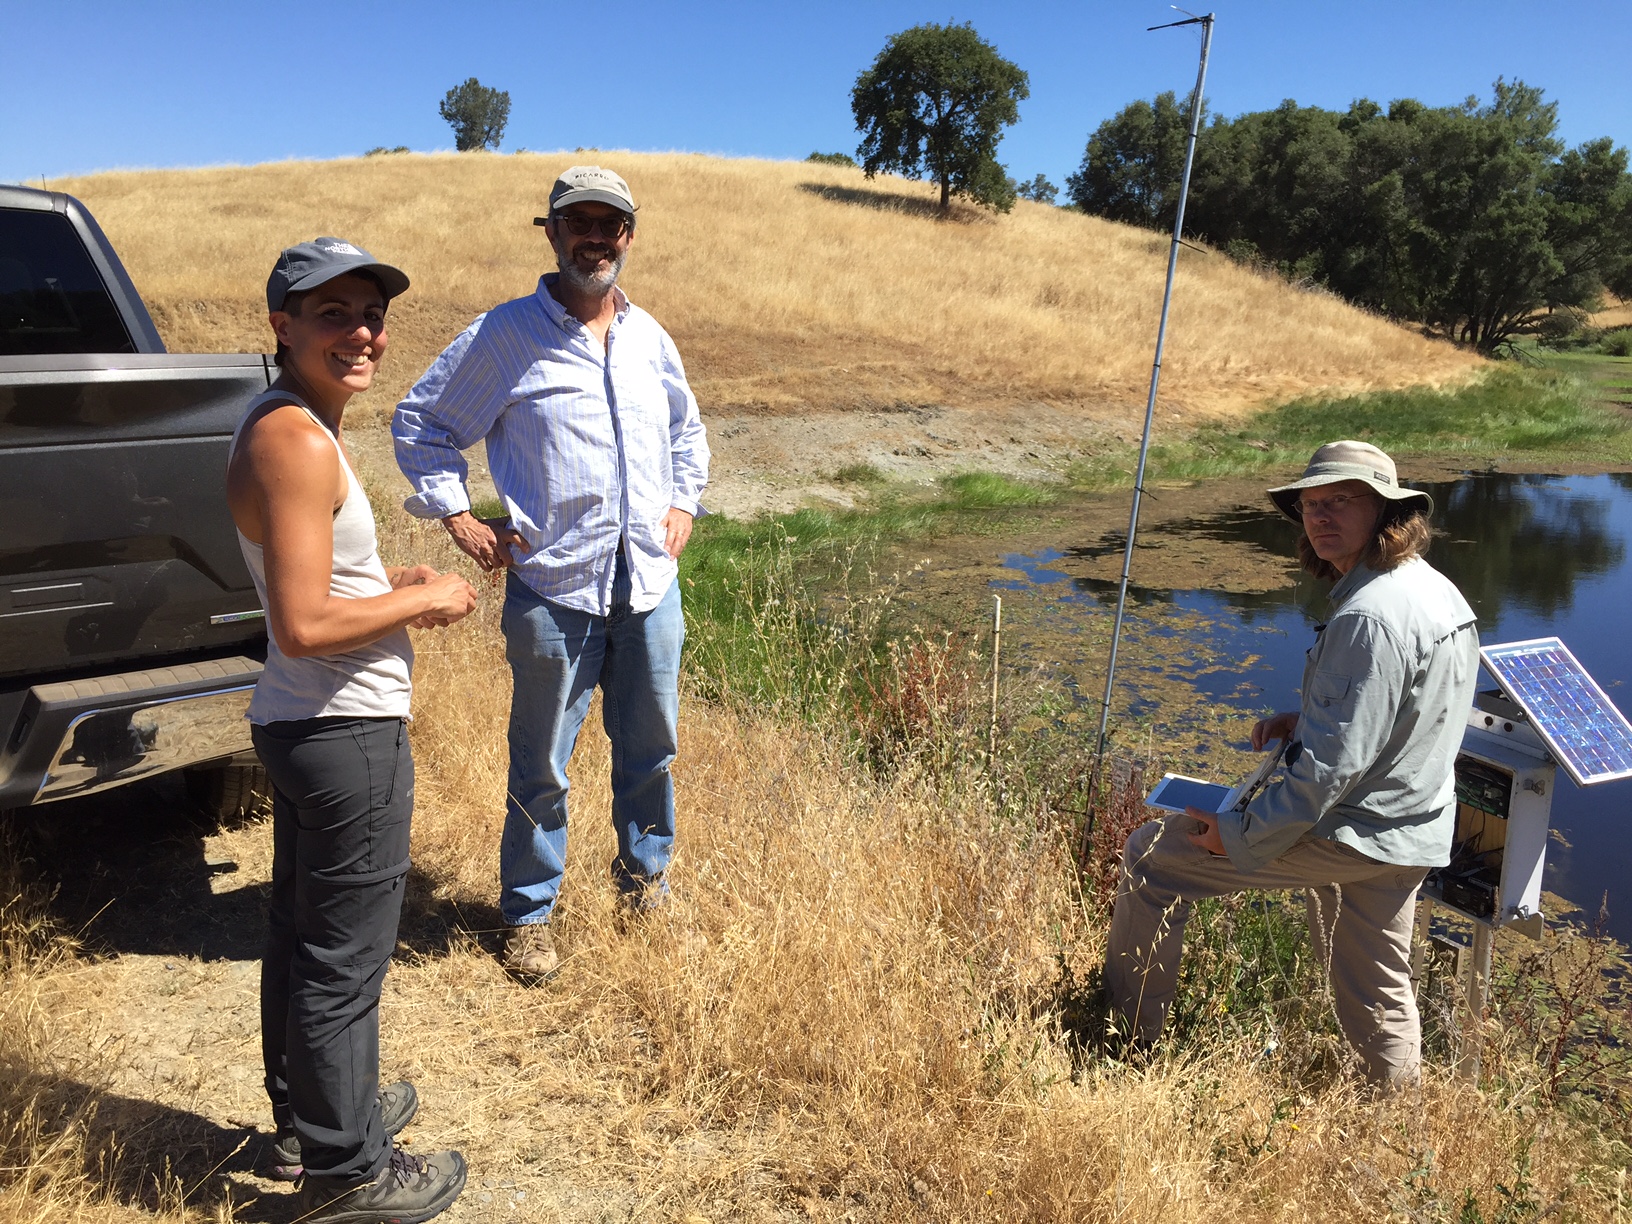
20180626VR_AnaDennisJoePond.jpg ( 2018-06-26 10:37:07 ) Full size: 1632x1224
Ana, Dennis and Joe at the Vaira Pond
9 sets found
16 VR_met graphs found
2 VR_flux graphs found
6 VR_soilco2 graphs found
2 VR_pond graphs found
Can't check TZVR_mixed
No data found for VR_fd.
No data found for VR_processed.
No data found for VR_arable.
No data found for VR_soilvue.