
Field Notes
<--2018-05-31 09:50:00 | 2018-06-28 09:15:00-->Other sites visited today: Sherman Wetland | Bouldin Alfalfa | West Pond | East End | East Pond
Phenocam link: Searching...
Bouldin Corn: 2018-06-14 09:25:00 (DOY 165)
Author: Katrina Cone
Others: Daphne, Dennis, Kyle
Summary: Regular data collection/cleaning, Arable installed
| 2018-06-14 Bouldin Corn We arrived at 9:25, and it was sunny, warm, breezy, and skies were clear. The corn planted two weeks ago has since sprouted (approximately 20 cm). Sabina visited the site. Kyle did clip plots and cleaned the rad sensors, Dennis measured vegetation height, and I made handheld LAI measurements. The wash reservoir was mostly full and we topped it off. We put up the Arable sn A000251 (originally at Twitchell Alfalfa) with sensors facing west on the cross-brace between the rad boom and flux sensors. Li-7550 box hose clamp had broken, so Kyle reattached it with new hose clamps. VWC numbers seem reasonable since they were reinstalled, and we didn't see any drops. LI-7500 readings: CO2 398ppm H2O 611ppm T 21.9 C P 100.3kPa SS 100 --> 99 after cleaning LI7700 readings CH4 1.94ppm RSSI 40 --> 87 after cleaning We left at 10:20. |
Veg Height (cm): Tape measure from ground to top of plant
17, 21, 19, 26, 29, 18, 26, 18, 21, 25, 24, 25, 19, 14, 17, 23, 20, 29, 13, 20, 15, avg = 20.9, stdev = 4.65
1 photos found
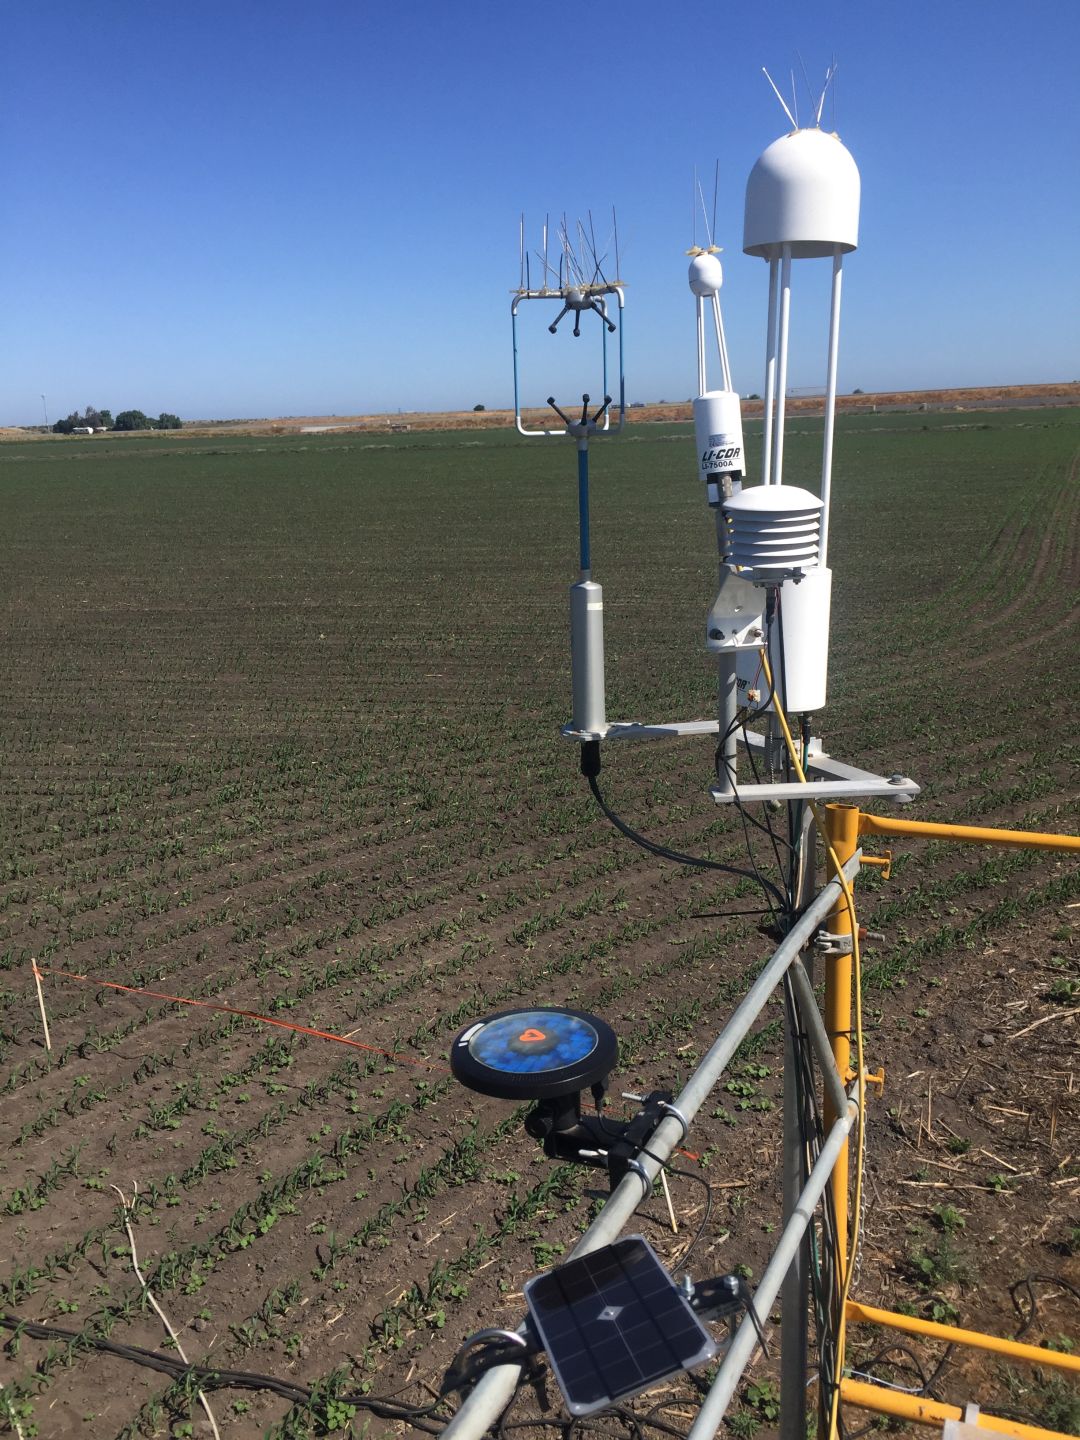
20180614BC_ArableInstallation.jpg ( 2018-06-14 00:00:00 ) Full size: 1080x1440
Arable weather station and small solar panel installed on top of the corn tower
6 sets found
17 BC_met graphs found
5 BC_flux graphs found
Can't check TATWBABCSB_cam
Can't check MBSWEEWPBCBA
No data found for BC_pa.
No data found for BC_arable.