Field Notes
<--2006-07-31 00:00:00 |
2006-08-17 10:51:00-->
Phenocam link:
Searching...Tonzi: 2006-08-01 09:30:00 (DOY 213)
Author: Siyan Ma
Others: Jessica
When: Date: 8/1/2006 ,
Day: 213 ,
Watch Time: 9:30am .
Where: Tonzi/Vaira Ranch
Who: Siyan and Jessica
Weather:
clear, nice breezle
Phenology:
dead grass, green oak leaf, very dry
Summary
- swap Li-7500 at Tower and Vaira.
- check and download data at Tower, Floor, and Vaira. Flux systems
worked well.
- Reset PC time at Tower and Floor with GPS.
- oak leaf and branch sample for specific leaf area and N
- oak woody and soil samples in Tonzi (Alex). No litter sample anymore
according to Alexander’s notice. (sampling frequency: once a month). Labeling starts from MIBA-US-03-183 to 187. (NOT THIS TIME.)
- soil moisture, dendrometer, spectrometer measurement
Vaira_Grass
Site
- Fence and gate power: >12 v.
- Panel and Batteries: 13.6 v; 11.6 amps; 3.0 amps.
- Reading from Gillsonic screen
before downloading data. (The value
of H2O and CO2 should be in the range of 0 – 5 v.)
Time
|
9:20:10
|
Path/File name
|
D:\Data\V06_212 .flx
D:\Data\VR062121500 .raw
|
|
mean
|
std
|
|
mean
|
std
|
w
|
0.05
|
0.27
|
Ts
|
21.9
|
1.00
|
u
|
0.72
|
0.5
|
H2O
|
3.1
|
0.03
|
v
|
1.35
|
0.4
|
CO2
|
1.6
|
0.09
|
- downloading data
- swaping Li-7500
Analyzer. (Remove SN# 41 ; install SN# 65 )
- check the fans of air temp.
and relative humidity sensors at Vaira.YES
- Check MD-9 system connections
NOT CHECK
- Check CR23X with two
multiplexers
Sys_vot = NOT CHECK
PC_start = NOT CHECK
- Check levels of Radiation
sensors, clear up surfaces. YES.
9. Closed gate and
set up fence. YES.
Tonzi_Tower Site
- Fence and gate power: >12 v.
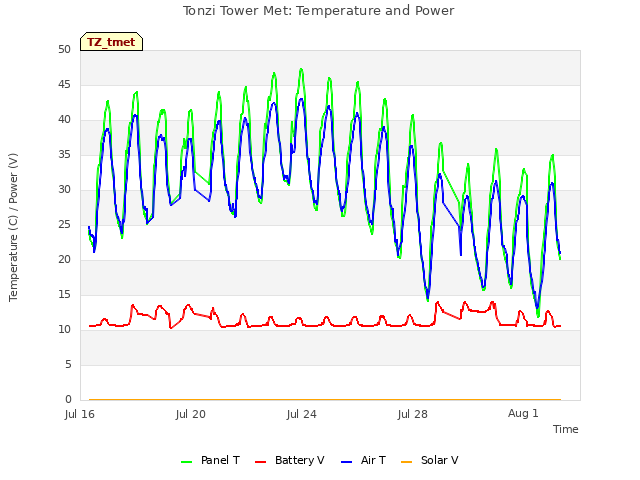
- Panel and Batteries: 14.2 v; 0.0 amps; 2.9 amps.
- Reading from Gillsonic screen
before downloading data. (The value
of H2O and CO2 should be in the range of 0 – 5 v.)
Time
|
10:09:34
|
Path/File name
|
D:\Data\T06_ 213 .flx
D:\Data\TW0621310000 .raw
|
|
mean
|
std
|
|
mean
|
std
|
w
|
1.0
|
0.9
|
Ts
|
22.9
|
1.8
|
u
|
4.8
|
1.7
|
H2O
|
3.15
|
0.09
|
v
|
1.7
|
1.2
|
CO2
|
1.001
|
0.05
|
- downloading data
- swaping Li-7500
Analyzer. (Remove SN# 35 ; install SN# 73 )
- check the fans of air temp.
and relative humidity sensors on the tower and the floor. YES.
- Check calibration
cylinders; NOT WORKING.
- close gate and set up fence. YES.
Toniz_Floor
Site
- Fence and gate power: >12 v.
- Panel and Batteries: 13.6 v; 12.8 amps; 1.8 amps.
- Reading from Gillsonic screen
before downloading data. (The value
of H2O and CO2 should be in the range of 0 – 5 v.)
Time
|
10:31:34
|
Path/File name
|
D:\Data\F06_ 212 .flx
D:\Data\FL06 2121430 .raw
|
|
mean
|
std
|
|
Mean
|
std
|
w
|
-0.33
|
0.32
|
Ts
|
24.03
|
1.19
|
u
|
-0.28
|
0.73
|
H2O
|
2.5
|
0.02
|
v
|
0.51
|
0.49
|
CO2
|
1.7
|
0.03
|
- downloading data
- Check MD-9 system connections
YES.
CR23X3 – floor-Met
CR23X5 – soil CO 2
profile
CR23X6 – tower-Met
CR10X2 – floor-Met
CR10X4 – sap-flow
CR10X7 – CO 2 profile
CR10X8 – wind profile
- Soil CO2 profile
Reading
from datalogger
Panel
temp
|
33.1
|
|
|
Battery
voltage
|
12.8
|
|
|
CO2E_1
|
289
|
TCE_1
|
45.7
|
CO2W_1
|
406
|
TCW_1
|
27.1
|
CO2E_2
|
369
|
TCE_2
|
46.9
|
CO2W_2
|
593
|
TCW_2
|
25.9
|
CO2E_3
|
414
|
TCE_3
|
37.5
|
CO2W_3
|
1229
|
TCW_3
|
25.1
|
CO2E_4
|
542
|
TCE_4
|
32.1
|
CO2W_4
|
1150
|
TCW_4
|
25.7
|
Reading
from panels of analyzers
depth
|
Open
|
order
|
depth
|
Tree
|
order
|
2cm
(1%)
|
570
|
1
|
2cm
(1%)
|
820
|
1
|
4cm
|
760
|
2
|
4cm
|
2310
|
4
|
8cm
|
840
|
3
|
8cm
|
1200
|
2
|
16cm
|
1130
|
4
|
16cm
|
0.47%
|
3
|
- Close gate and set up fence.
YES.
tonzi
|
7931AFE
|
402165
|
574B4B
|
402FF3
|
574632
|
7A432E
|
7A3C6E
|
7A3B40
|
7A4AAA
|
8/1/2006
|
213
|
|
|
|
|
|
|
|
|
|
SM
|
|
|
|
|
|
|
|
|
0-15
|
6.6
|
3.3
|
5.9
|
3.1
|
6.0
|
5.7
|
4.8
|
3.7
|
1.2
|
15-30
|
13.0
|
12.8
|
13.7
|
10.8
|
1.2
|
7.2
|
12.2
|
11.7
|
1.9
|
30-45
|
18.0
|
7.6
|
6.0
|
13.8
|
2.2
|
9.5
|
14.6
|
16.2
|
12.2
|
45-60
|
13.7
|
4.4
|
2.9
|
12.9
|
13.5
|
11.0
|
13.5
|
20.1
|
9.1
|
|
|
|
|
|
|
|
|
|
|
|
A6D882B
|
A3D04E8
|
A6D72F5
|
|
|
|
|
|
|
|
|
|
|
|
|
|
|
|
|
0-15
|
37.4
|
6.8
|
1.2
|
|
|
|
|
|
|
15-30
|
4.8
|
6.8
|
10.8
|
|
|
|
|
|
|
30-45
|
11.1
|
17.6
|
13.0
|
|
|
|
|
|
|
45-60
|
39.0
|
13.2
|
2.4
|
|
|
|
|
|
|
|
|
|
|
|
|
|
|
|
|
vaira
|
57318a
|
7933dee
|
|
|
|
|
|
|
|
0-15
|
2.4
|
3.6
|
|
|
|
|
|
|
|
15-30
|
4.2
|
10.6
|
|
|
|
|
|
|
|
30-45
|
11.8
|
13.5
|
|
|
|
|
|
|
|
45-60
|
17.0
|
19.7
|
|
|
|
|
|
|
|
Tonzi
|
|
|
|
Dendrometer
|
|
|
|
|
|
|
Date
|
Day
|
Tag #
|
Reading (cm)
|
8/1/2006
|
213
|
71
|
22.5
|
|
|
72
|
23.4
|
|
|
77
|
Broken
|
|
|
78
|
Broken
|
|
|
79
|
23.2
|
|
|
245
|
22.4
|
|
|
248
|
24.5
|
|
|
250
|
21.9
|
|
|
255
|
22.5
|
|
|
252
|
missing
|
|
|
102
|
Broken
|
Sample sheet for MIBA
Sample vial
|
What
|
MIBA-US-01.183_
|
Leave 1
|
MIBA-US-01.184__
|
Leave 2
|
MIBA-US-01. _-___
|
Grass 1
|
MIBA-US-01. -__
|
Grass 2
|
MIBA-US-01. _185_
|
Soil in 10 cm
|
MIBA-US-01. _186__
|
Stem 1
|
MIBA-US-01. 187__
|
Stem 2
|
|
Field Data
No tank data
No TZ Well data found
No TZ Moisture Point data found
No VR Moisture Point data found
No TZ grass heigth found
No VR grass heigth found
No TZ Tree DBH found
No water potential data found
No TZ Grass Biomass data found
No TZ OakLeaves Biomass data found
No TZ PineNeedles Biomass data found
0 photos found
16 sets found
No data found for TZ_Fenergy.
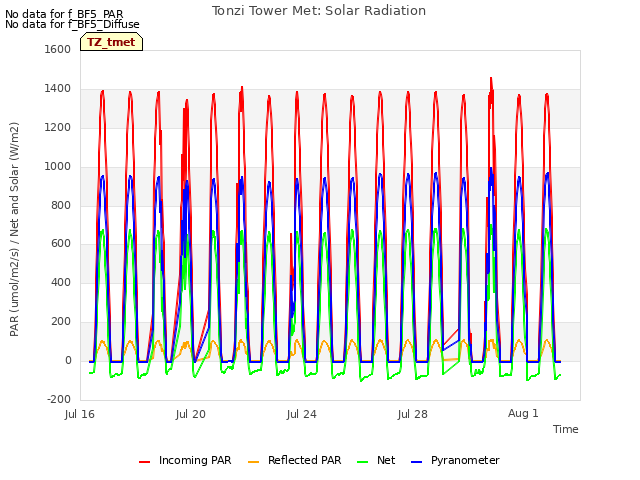
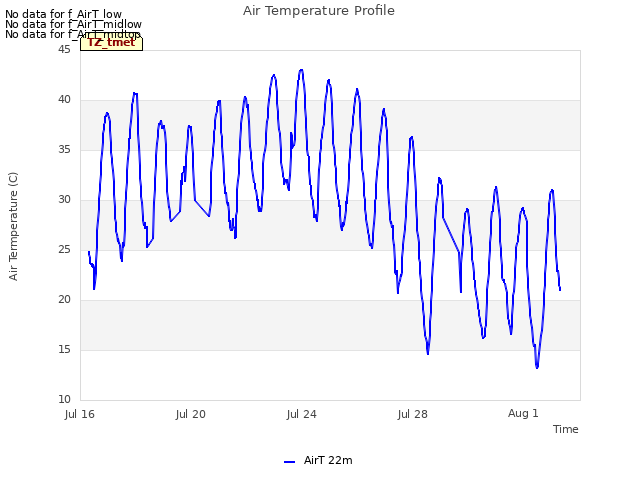
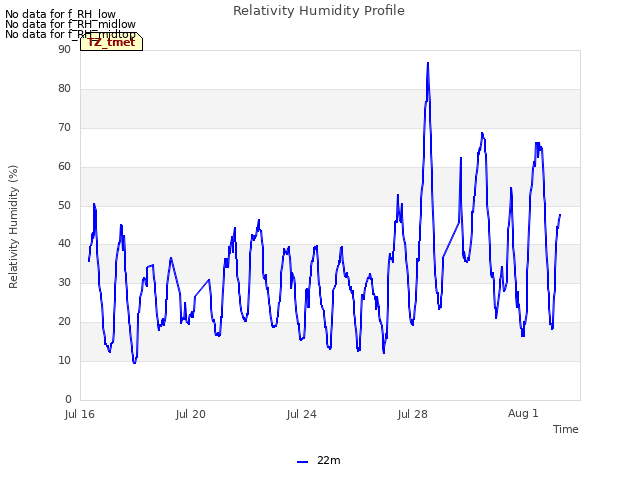
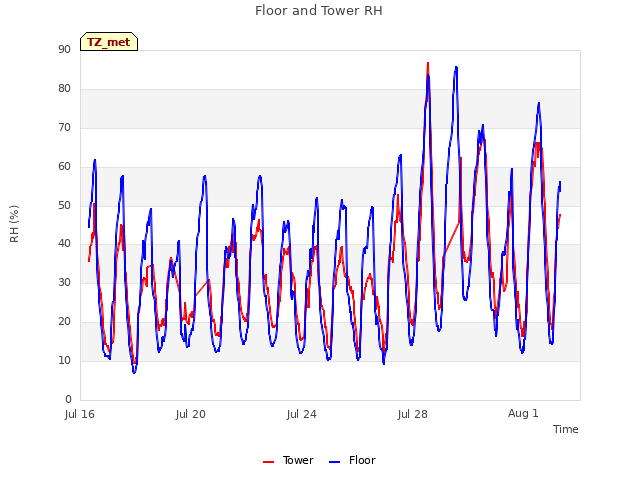
11 TZ_tmet graphs found


No data found for TZ_soilco2.
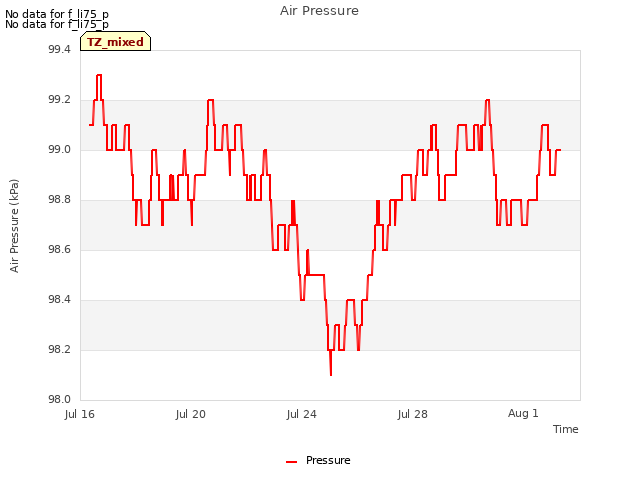
Can't check TZ_mixed
3 TZ_mixed graphs found

No data found for TZ_fflux.
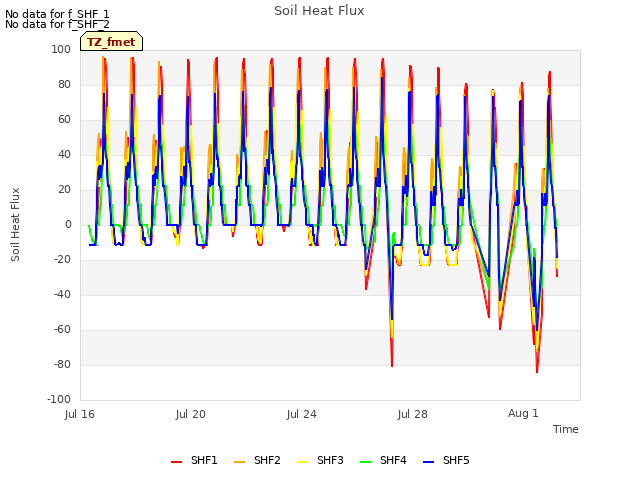
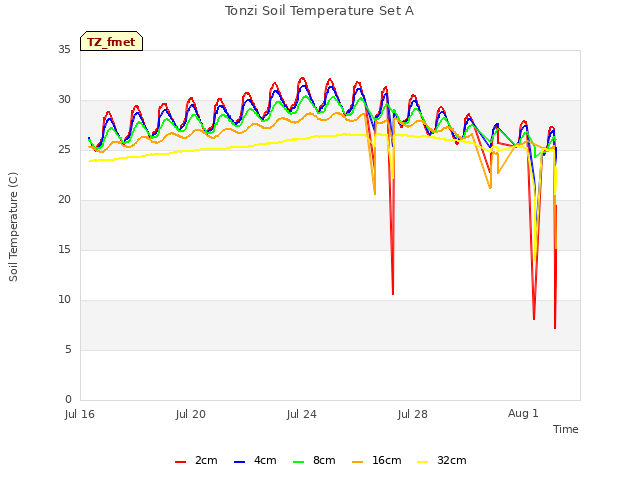
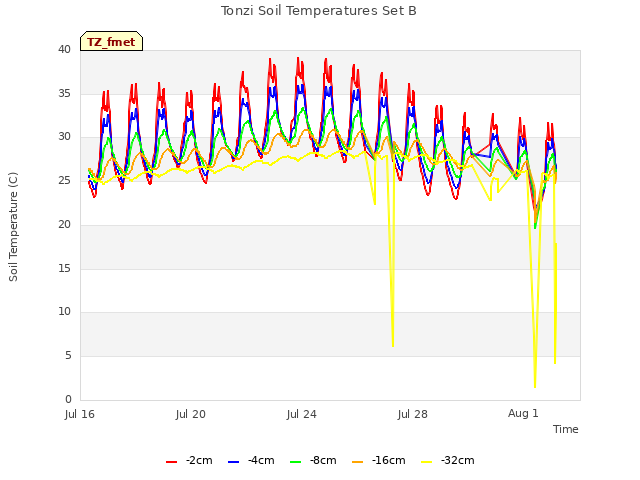
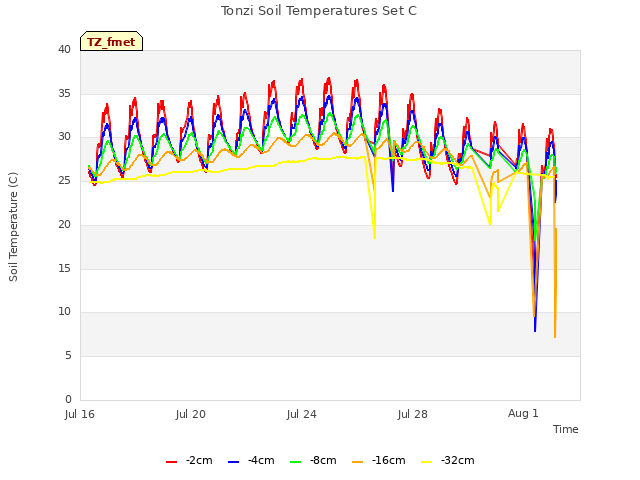
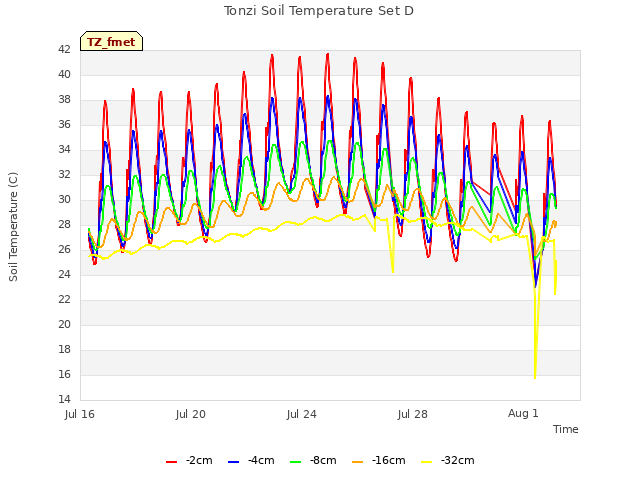
8 TZ_fmet graphs found


No data found for TZ_tram.
No data found for TZ_co2prof.
No data found for TZ_irt.
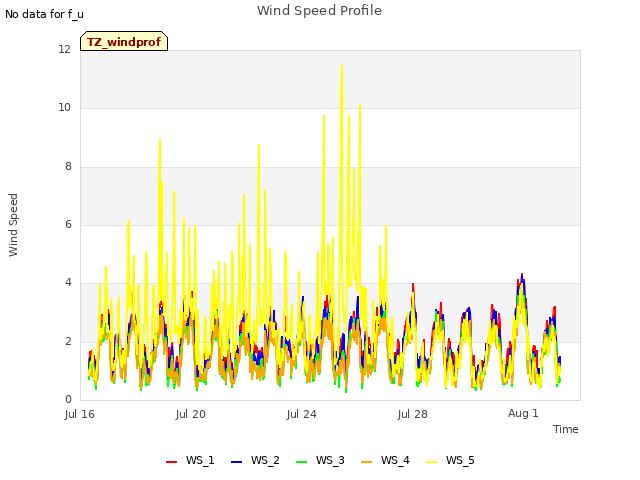
1 TZ_windprof graphs found
No data found for TZ_tflux.
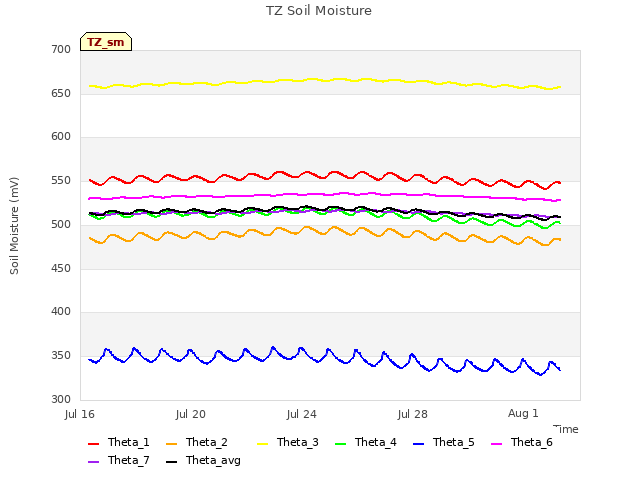
2 TZ_sm graphs found

Can't check TZ_met
1 TZ_met graphs found
Can't check TZVR_mixed
No data found for TZ_osu.
No data found for TZ_fd.
Tonzi Z-cam data


