Field Notes

<--2017-05-10 14:25:00 | 2017-06-05 15:00:00-->
Other sites visited today: Bouldin Corn | East End | Bouldin Alfalfa | Twitchell Alfalfa | West Pond | Sherman Wetland
Phenocam link: Searching...

Mayberry: 2017-05-25 10:35:00 (DOY 145)
Author: Daphne Szutu
Others: Dennis, Joe, Sam, Kristen M (USGS)

Summary: Regular data collection/cleaning, Installed float on folding boom, Collected water samples, Removed HOBO salinity probe

2017-05-25
Mayberry

We arrived at 10:00. It was sunny and mostly clear. They've mowed the grass path leading up to the tower. The water level was higher than before,

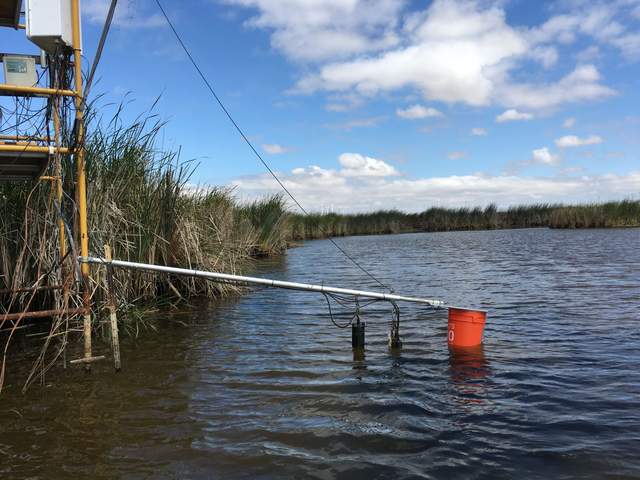
Joe installed a float at the end of the folding boom. The "mid" DO (sn 1220) and CO2 are now at the bottom of the profile (-62 cm), just above the mud. The "bot" DO (sn 1219) and CO2 are now at the top of the profile (-17 cm), same as the "top" DO (sn 1221) and CO2 sensors (-17 cm).

Joe also collected 3 water samples while standing on the tower (to prevent water disturbance). He sampled waters on the east side of the tower.

Sam removed the HOBO salinity sensor sn 11020258 for use on the summer temporary towers.

I collect met, camera, and USB GHG data. Sam cleaned the radiation and EC sensors and refilled the wash reservoir.

LI7500 readings:
CO2 406.9 umol/mol
H2O 590.4 mmol/m3
T 19.2 Celsius
P 100.7 kPa
SS 93.7 -> 95.1 after cleaning

LI7700 readings:
CH4: 1.8
RSSI: 41.0 -> 74.0 after cleaning

We left at 10:35.

1 photos found

Installed a 5-gal bucket on the end of the folding boom to make it float. The miniDOT and eosGP sensors should now remain at the same approx height relative to the water surface
20170525MB_WaterSensorsFloat.jpg ( 2017-05-25 10:32:03 ) Full size: 1920x1440
Installed a 5-gal bucket on the end of the folding boom to make it float. The miniDOT and eosGP sensors should now remain at the same approx height relative to the water surface

Graphs display:
11 sets found

7 MB_flux graphs found

Explore the graph:Sonic Wind in a new window

Explore the graph:LI7700 mV signals in a new window

Explore the graph:Counts in a new window

Explore the graph:LI7700 CH4 from analog signal in a new window

Explore the graph:LI7500 CO2 and H2O in a new window

Explore the graph:LI7700 CH4 from digital signal in a new window

Explore the graph:CO2 in ppm in a new window

No data found for MB_met.
28 MB_tule graphs found

Explore the graph:MB Tule Tower: Open Water 2 (3/1/11-3/23/17) in a new window

Explore the graph:MB Tule Tower: Open Water 1 (3/1/11-2/21/13) in a new window

Explore the graph:MB Tule Tower: Tule Temps 2 & 3 (3/1/11-3/19/14) in a new window

Explore the graph:MB Tule Tower: Tule Temps 1 (3/1/11-3/19/14) in a new window

Explore the graph:Mayberry Tule Tower: Solar Radiation in a new window

Explore the graph:Mayberry Tule Tower: Disolved Oxygen in a new window

Explore the graph:Mayberry Tule Tower: IRT and Sensor Temp in a new window

Explore the graph:Mayberry Tule Tower: Volts and RH in a new window

Explore the graph:LED NDVI Sensor in a new window

Explore the graph:Water CO2 in a new window

Explore the graph:Water Pressure in a new window

Explore the graph:Fluorometer Data in a new window

Explore the graph:Mayberry pCO2 Profile in a new window

Explore the graph:Water Temperatures in a new window

Explore the graph:Air Temperatures in a new window

Explore the graph:Air Pressure in a new window

Explore the graph:4-Way Radiometer in a new window

Explore the graph:MB Tule Tower: Open Water 1 (2/21/13-3/19/14) in a new window

Explore the graph:MB Tule Tower: Tule Temps 1 (3/19/14-now) in a new window

Explore the graph:MB Tule Tower: Open Water 1 (3/19/14-now) in a new window

Explore the graph:MB Tule Tower: Tule Temps 2 & 3 (3/19/14-3/23/17) in a new window

Explore the graph:MB Tule Tower: Tule Temps 2 (3/23/17-now) in a new window

Explore the graph:MB Tule Tower: Tule Temps 3 (3/23/17-now) in a new window

Explore the graph:SRS NDVI Channels in a new window

Explore the graph:SRS NDVI in a new window

Explore the graph:Net Radiation in a new window

Explore the graph:Conductivity in a new window

Explore the graph:Soil electrical conductivity in a new window

Can't check MBWPEESWGT_mixed
1 MB_cam graphs found

Explore the graph:Mayberry Autocam GCC in a new window

Can't check MBEEWPSWEPGT_cam
Can't check SIMBTWEE_met
1 MB_minidot graphs found

Explore the graph:Mayberry miniDot Dissolved Oxygen in a new window

Can't check MBSWEEWPBCBA
1 MB_processed graphs found

Explore the graph:Mayberry processed CO2 Fluxes in a new window

Can't check MB_fd
1 MB_fd graphs found

Explore the graph:Water Forced Diffusion CO2 Flux in a new window