
Field Notes
<--2017-04-24 10:00:00 | 2017-05-24 10:00:00-->Other sites visited today: Tonzi | Tonzi
Phenocam link: Searching...
Vaira: 2017-05-11 09:00:00 (DOY 131)
Author: Joe Verfaillie
Others: Siyan, Daphne
Summary: Set up radio to pond, installed Ameriflux eddy equipment, standard fieldwork, grass is turning brown
| Vaira 2017-05-11 I arrived about 9am with Siyan and Daphne. The grass is turning brown and the road and ground are dry. There is a different mix of grass species this year. The grasses seem shorter, denser and have more seeds. There was a truck and bobcat tractor working on the fence line on the south edge of the property. And a truck with cow trailer went past while we were at the site. We went to the pond first. The water level there has dropped by about 1.5ft to 20.68ft in the last two weeks. We pounded in a small fence post just north of the data logger box and hose clamped a piece of 10ft metal conduit to it mounting the antenna of the Campbell radio RF400 sn ???? to the top. The radio is in the data logger box and powered over the CSIO port. Back at the tower Siyan did the regular fieldwork and Daphne worked on the eddy systems. I put the other radio sn ???? in the 23x box on the radiation tower and its antenna at the top of a 10ft metal conduit attached to the same post the data logger box is attached to. The antenna is a little higher than the rest of the tower. I powered the radio from a 23x 12V port and used an existing cable that was set up for a CSIO port as the serial line back to the computer box. I cut the CSIO wired connector off and added a RS232 screw terminal connector. The data logger box could use some rewiring, especially a power strip. Amazingly it all seemed to work and I was able to connect to the pond. I set up the computer to collect the pond data and send it to Berkeley. Daphne removed our temporary LI-7500A eddy system (sn 75H-2150, sn AIU-0650, sn 153805) and moved the old original eddy system to the temporary mount. Then she installed the new eddy system from Ameriflux sn 0035, sn AIU-1870 sn 170524 on the permanent mount. The old system and the temporary systems were running at 10Hz. The new system is running at 20Hz. All seemed to go well, but the new Gorilla USB drive did not work in the new Licor AIU. We reused the USB drive from the temporary 7500A system. Also, there may be some settings in the new AIU that need adjusting – clock, analog inputs. Both sonics are oriented to true north plus minus a couple of degrees. New 7500 read: 404.1ppm CO2, 540.6mmol/m3 H2O, 19.4C, 100.1kPa, 99.8SS |
Veg Height (cm): Tape measure from ground to top of plant - Outside fenced area - grazed
42, 43, 53, 46, 56, 76, 118, 76, 88, 92, 40, 50, 52, 60, 72, avg = 64.3, stdev = 22.35
Field Data
No tank data
Well Depth
| Date | Location | Depth (feet) |
|---|---|---|
| 2017-05-11 | TZ_floor | 8.3 |
| 2017-05-11 | TZ_road | 17.8 |
| 2017-05-11 | TZ_tower | 13.1 |
| 2017-05-11 | VR_pond | 20.68 |
mode = both
Moisture Point Probes TZ
Array
(
[0] => Tower_1
[1] => Floor_South_1
[2] => Floor_East_1
[3] => Floor_West_1
[4] => Soil_Transect_4_1
[5] => Soil_Transect_3_1
[6] => Soil_Transect_2_1
[7] => Soil_Transect_1_1
[8] => SoilCO2_West_A_1
[9] => SoilCO2_West_B_1
[10] => SoilCO2_West_C_1
[11] => Tower_2
[12] => Floor_South_2
[13] => Floor_East_2
[14] => Floor_West_2
[15] => Soil_Transect_4_2
[16] => Soil_Transect_3_2
[17] => Soil_Transect_2_2
[18] => Soil_Transect_1_2
[19] => SoilCO2_West_A_2
[20] => SoilCO2_West_B_2
[21] => SoilCO2_West_C_2
[22] => Tower_3
[23] => Floor_South_3
[24] => Floor_East_3
[25] => Floor_West_3
[26] => Soil_Transect_4_3
[27] => Soil_Transect_3_3
[28] => Soil_Transect_2_3
[29] => Soil_Transect_1_3
[30] => SoilCO2_West_A_3
[31] => SoilCO2_West_B_3
[32] => SoilCO2_West_C_3
[33] => Tower_4
[34] => Floor_South_4
[35] => Floor_East_4
[36] => Floor_West_4
[37] => Soil_Transect_4_4
[38] => Soil_Transect_3_4
[39] => Soil_Transect_2_4
[40] => Soil_Transect_1_4
[41] => SoilCO2_West_A_4
[42] => SoilCO2_West_B_4
[43] => SoilCO2_West_C_4
)
| Date | DOY | Rep | Depth | Tower_1 |
Floor_South_1 |
Floor_East_1 |
Floor_West_1 |
Soil_Transect_4_1 |
Soil_Transect_3_1 |
Soil_Transect_2_1 |
Soil_Transect_1_1 |
SoilCO2_West_A_1 |
SoilCO2_West_B_1 |
SoilCO2_West_C_1 |
Tower_2 |
Floor_South_2 |
Floor_East_2 |
Floor_West_2 |
Soil_Transect_4_2 |
Soil_Transect_3_2 |
Soil_Transect_2_2 |
Soil_Transect_1_2 |
SoilCO2_West_A_2 |
SoilCO2_West_B_2 |
SoilCO2_West_C_2 |
Tower_3 |
Floor_South_3 |
Floor_East_3 |
Floor_West_3 |
Soil_Transect_4_3 |
Soil_Transect_3_3 |
Soil_Transect_2_3 |
Soil_Transect_1_3 |
SoilCO2_West_A_3 |
SoilCO2_West_B_3 |
SoilCO2_West_C_3 |
Tower_4 |
Floor_South_4 |
Floor_East_4 |
Floor_West_4 |
Soil_Transect_4_4 |
Soil_Transect_3_4 |
Soil_Transect_2_4 |
Soil_Transect_1_4 |
SoilCO2_West_A_4 |
SoilCO2_West_B_4 |
SoilCO2_West_C_4 |
Avg | Spacial Count |
Measurement Count |
|---|---|---|---|---|---|---|---|---|---|---|---|---|---|---|---|---|---|---|---|---|---|---|---|---|---|---|---|---|---|---|---|---|---|---|---|---|---|---|---|---|---|---|---|---|---|---|---|---|---|---|
| 2017-05-11 | 131 | 0 | nan | 11.2 | 7.7 | 15 | 13.2 | 1.9 | 8.3 | 10.6 | 11.5 | 13 | 15 | 14.4 | 22.2 | 13 | 24 | 18.2 | 13.3 | 21.9 | 21 | 7.8 | 18.2 | 10 | 20.6 | 23.5 | 27.9 | 36.3 | 27.4 | 16.8 | 22.9 | 25.7 | 24.3 | 28.2 | 26 | 30.7 | 34.8 | 52.6 | 57.2 | 43.4 | 23.1 | 38 | 39.7 | 20.2 | 40 | 43.1 | 46.8 | |||
| 2017-05-11 | 131 | 1 | nan | 10.6 | 7.4 | 14.4 | 13.2 | 0.9 | 8.3 | 11.8 | 14.1 | 13.2 | 14.4 | 21.6 | 17 | 24 | 18.5 | 13 | 31.4 | 7.8 | 19.7 | 9 | 21.3 | 23.5 | 28.5 | 36 | 27.8 | 15.9 | 21.8 | 24 | 27.6 | 26 | 30.1 | 34.8 | 53.7 | 58.9 | 43.1 | 23.4 | 37.1 | 19.9 | 41.7 | 42.8 | 46.8 | |||||||
| 2017-05-11 | 131 | Avg | 0-15cm | 0 | 0 | |||||||||||||||||||||||||||||||||||||||||||||
| 2017-05-11 | 131 | Avg | 15-30cm | 0 | 0 | |||||||||||||||||||||||||||||||||||||||||||||
| 2017-05-11 | 131 | Avg | 30-45cm | 0 | 0 | |||||||||||||||||||||||||||||||||||||||||||||
| 2017-05-11 | 131 | Avg | 45-60cm | 0 | 0 |
mode = both
Moisture Point Probes VR
Array
(
[0] => Solar_Panels_1
[1] => Flux_Tower_1
[2] => Gate_1
[3] => Biomass_Cage_1
[4] => Solar_Panels_2
[5] => Flux_Tower_2
[6] => Gate_2
[7] => Biomass_Cage_2
[8] => Solar_Panels_3
[9] => Flux_Tower_3
[10] => Gate_3
[11] => Biomass_Cage_3
[12] => Solar_Panels_4
[13] => Flux_Tower_4
[14] => Gate_4
[15] => Biomass_Cage_4
)
| Date | DOY | Rep | Depth | Solar_Panels_1 |
Flux_Tower_1 |
Gate_1 |
Biomass_Cage_1 |
Solar_Panels_2 |
Flux_Tower_2 |
Gate_2 |
Biomass_Cage_2 |
Solar_Panels_3 |
Flux_Tower_3 |
Gate_3 |
Biomass_Cage_3 |
Solar_Panels_4 |
Flux_Tower_4 |
Gate_4 |
Biomass_Cage_4 |
Avg | Spacial Count |
Measurement Count |
|---|---|---|---|---|---|---|---|---|---|---|---|---|---|---|---|---|---|---|---|---|---|---|
| 2017-05-11 | 131 | 0 | nan | 8 | 8.6 | 8.8 | 2.7 | 21.6 | 15.6 | 11.2 | 9.7 | 23.5 | 11.1 | 14.5 | 19.8 | 24.8 | 21.6 | 15 | 21.6 | |||
| 2017-05-11 | 131 | 1 | nan | 7.4 | 8.3 | 8.6 | 2.4 | 21.6 | 16.1 | 11.2 | 9.3 | 22.6 | 9 | 14 | 19.5 | 25.1 | 21.6 | 14.5 | 31.5 | |||
| 2017-05-11 | 131 | Avg | 0-15cm | 0 | 0 | |||||||||||||||||
| 2017-05-11 | 131 | Avg | 15-30cm | 0 | 0 | |||||||||||||||||
| 2017-05-11 | 131 | Avg | 30-45cm | 0 | 0 | |||||||||||||||||
| 2017-05-11 | 131 | Avg | 45-60cm | 0 | 0 |
No TZ grass heigth found
Grass Height VR 15
| Date | Height reps (cm) | Location | Average | Samp | STDEV | ||||||||||||||
|---|---|---|---|---|---|---|---|---|---|---|---|---|---|---|---|---|---|---|---|
| 2017-05-11 | 42 | 43 | 53 | 46 | 56 | 76 | 118 | 76 | 88 | 92 | 40 | 50 | 52 | 60 | 72 | GH_ALL | 64.27 | 15 | 21.59 |
No VR Tree DBH found
No water potential data found
No VR Grass Biomass data found
No VR OakLeaves Biomass data found
No VR PineNeedles Biomass data found
1 photos found
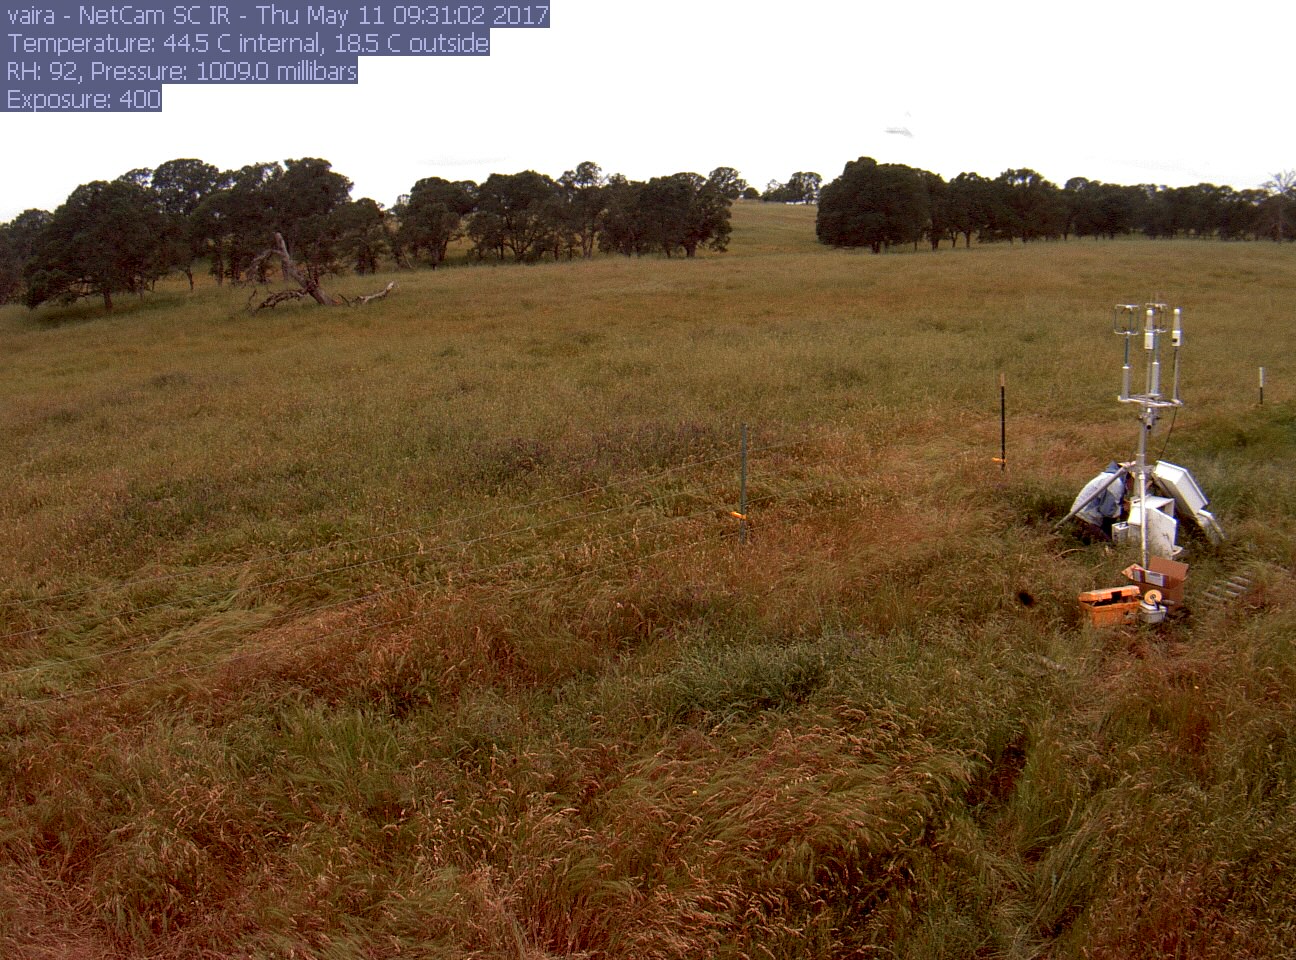
vaira_2017_05_11_093101.jpg ( 2017-05-11 08:30:20 ) Full size: 1296x960
Fieldwork
9 sets found
16 VR_met graphs found
2 VR_flux graphs found
6 VR_soilco2 graphs found
2 VR_pond graphs found
Can't check TZVR_mixed
No data found for VR_fd.
No data found for VR_processed.
No data found for VR_arable.
No data found for VR_soilvue.