
Field Notes
<--2017-05-11 09:00:00 | 2017-06-01 12:30:00-->Other sites visited today: Tonzi | Tonzi
Phenocam link: Searching...
Vaira: 2017-05-24 10:00:00 (DOY 144)
Author: Joe Verfaillie
Others: Siyan, Daphne
Summary: standard fieldwork, removed old eddy system
| Vaira 2017-05-24 I arrived about 10am with Daphne and Siyan. It is much drier now and most of the grass has turned golden. Some of the low spots are still green and a couple of species near the tower are still green. We removed the old eddy system sonic sn 000028, PCI sn 000192, LI-7500 sn 0073, CR1000 sn 23865, CFM sn 4994. We removed the box that housed the CR1000 and sonic PCI along with all the cables. Some reorganization of the computer box was necessary. The quad serial port adapter is now put away under the keyboard rack. The 7500A read: 400.65ppm CO2, 505.8mmol/m3, 26.35C, 99.01kPa, 94.1SS – 99.6 after cleaning. Siyan did the standard fieldwork. We did not go to the pond as it has been sending its data by radio. |
Field Data
No tank data
Well Depth
| Date | Location | Depth (feet) |
|---|---|---|
| 2017-05-24 | TZ_floor | 9.55 |
| 2017-05-24 | TZ_road | 19 |
| 2017-05-24 | TZ_tower | 14.8 |
mode = both
Moisture Point Probes TZ
Array
(
[0] => Tower_1
[1] => Floor_South_1
[2] => Floor_West_1
[3] => Soil_Transect_4_1
[4] => Soil_Transect_3_1
[5] => Soil_Transect_2_1
[6] => Soil_Transect_1_1
[7] => SoilCO2_West_A_1
[8] => SoilCO2_West_B_1
[9] => SoilCO2_West_C_1
[10] => Tower_2
[11] => Floor_South_2
[12] => Floor_East_2
[13] => Floor_West_2
[14] => Soil_Transect_4_2
[15] => Soil_Transect_3_2
[16] => Soil_Transect_2_2
[17] => Soil_Transect_1_2
[18] => SoilCO2_West_A_2
[19] => SoilCO2_West_B_2
[20] => SoilCO2_West_C_2
[21] => Tower_3
[22] => Floor_South_3
[23] => Floor_East_3
[24] => Floor_West_3
[25] => Soil_Transect_4_3
[26] => Soil_Transect_3_3
[27] => Soil_Transect_2_3
[28] => Soil_Transect_1_3
[29] => SoilCO2_West_A_3
[30] => SoilCO2_West_B_3
[31] => SoilCO2_West_C_3
[32] => Tower_4
[33] => Floor_South_4
[34] => Floor_East_4
[35] => Floor_West_4
[36] => Soil_Transect_4_4
[37] => Soil_Transect_3_4
[38] => Soil_Transect_2_4
[39] => Soil_Transect_1_4
[40] => SoilCO2_West_A_4
[41] => SoilCO2_West_B_4
[42] => SoilCO2_West_C_4
)
| Date | DOY | Rep | Depth | Tower_1 |
Floor_South_1 |
Floor_West_1 |
Soil_Transect_4_1 |
Soil_Transect_3_1 |
Soil_Transect_2_1 |
Soil_Transect_1_1 |
SoilCO2_West_A_1 |
SoilCO2_West_B_1 |
SoilCO2_West_C_1 |
Tower_2 |
Floor_South_2 |
Floor_East_2 |
Floor_West_2 |
Soil_Transect_4_2 |
Soil_Transect_3_2 |
Soil_Transect_2_2 |
Soil_Transect_1_2 |
SoilCO2_West_A_2 |
SoilCO2_West_B_2 |
SoilCO2_West_C_2 |
Tower_3 |
Floor_South_3 |
Floor_East_3 |
Floor_West_3 |
Soil_Transect_4_3 |
Soil_Transect_3_3 |
Soil_Transect_2_3 |
Soil_Transect_1_3 |
SoilCO2_West_A_3 |
SoilCO2_West_B_3 |
SoilCO2_West_C_3 |
Tower_4 |
Floor_South_4 |
Floor_East_4 |
Floor_West_4 |
Soil_Transect_4_4 |
Soil_Transect_3_4 |
Soil_Transect_2_4 |
Soil_Transect_1_4 |
SoilCO2_West_A_4 |
SoilCO2_West_B_4 |
SoilCO2_West_C_4 |
Avg | Spacial Count |
Measurement Count |
|---|---|---|---|---|---|---|---|---|---|---|---|---|---|---|---|---|---|---|---|---|---|---|---|---|---|---|---|---|---|---|---|---|---|---|---|---|---|---|---|---|---|---|---|---|---|---|---|---|---|
| 2017-05-24 | 144 | 0 | nan | 9.7 | 3.9 | 13.8 | 11.1 | 3.4 | 3 | 8.3 | 9.7 | 9.7 | 7.1 | 15.8 | 14.2 | 17 | 6.3 | 9 | 16.4 | 14.5 | 0.4 | 13 | 1.7 | 14.8 | 18.7 | 14.8 | 24 | 15.6 | 11.2 | 17.6 | 19 | 16.8 | 21.5 | 19 | 21.5 | 22.2 | 21.3 | 40.3 | 25.1 | 13.9 | 24.8 | 31.1 | 14.2 | 21.9 | 19.1 | 29.7 | |||
| 2017-05-24 | 144 | 1 | nan | 8.8 | 3.9 | 15.6 | 11.1 | 6.2 | 5 | 8.8 | 10 | 9.7 | 7.4 | 5.2 | 14.2 | 14.2 | 6 | 9.3 | 17 | 14.2 | 5.1 | 14.8 | 0.8 | 15.2 | 18.2 | 14.5 | 23.7 | 15.6 | 11.7 | 17.6 | 19.3 | 16.8 | 20.9 | 19.3 | 21.8 | 23.4 | 21.1 | 37.1 | 21.1 | 13.9 | 24.8 | 21.4 | 15 | 21.9 | 18.5 | 29.9 | |||
| 2017-05-24 | 144 | Avg | 0-15cm | 0 | 0 | ||||||||||||||||||||||||||||||||||||||||||||
| 2017-05-24 | 144 | Avg | 15-30cm | 0 | 0 | ||||||||||||||||||||||||||||||||||||||||||||
| 2017-05-24 | 144 | Avg | 30-45cm | 0 | 0 | ||||||||||||||||||||||||||||||||||||||||||||
| 2017-05-24 | 144 | Avg | 45-60cm | 0 | 0 |
mode = both
Moisture Point Probes VR
Array
(
[0] => Solar_Panels_1
[1] => Flux_Tower_1
[2] => Gate_1
[3] => Biomass_Cage_1
[4] => Solar_Panels_2
[5] => Flux_Tower_2
[6] => Gate_2
[7] => Biomass_Cage_2
[8] => Solar_Panels_3
[9] => Flux_Tower_3
[10] => Gate_3
[11] => Biomass_Cage_3
[12] => Solar_Panels_4
[13] => Flux_Tower_4
[14] => Gate_4
[15] => Biomass_Cage_4
)
| Date | DOY | Rep | Depth | Solar_Panels_1 |
Flux_Tower_1 |
Gate_1 |
Biomass_Cage_1 |
Solar_Panels_2 |
Flux_Tower_2 |
Gate_2 |
Biomass_Cage_2 |
Solar_Panels_3 |
Flux_Tower_3 |
Gate_3 |
Biomass_Cage_3 |
Solar_Panels_4 |
Flux_Tower_4 |
Gate_4 |
Biomass_Cage_4 |
Avg | Spacial Count |
Measurement Count |
|---|---|---|---|---|---|---|---|---|---|---|---|---|---|---|---|---|---|---|---|---|---|---|
| 2017-05-24 | 144 | 0 | nan | 5 | 5.3 | 1.2 | 0.6 | 11.8 | 8.1 | 9.3 | 12.4 | 15.4 | 5 | 12.9 | 15.9 | 28.5 | 17.6 | 13.3 | 13.9 | |||
| 2017-05-24 | 144 | 1 | nan | 4.7 | 4.2 | 1.2 | 0.1 | 11.2 | 8.1 | 8.7 | 12.7 | 16.2 | 4.5 | 9.2 | 17.6 | 28.2 | 17 | 10.5 | 14.5 | |||
| 2017-05-24 | 144 | Avg | 0-15cm | 0 | 0 | |||||||||||||||||
| 2017-05-24 | 144 | Avg | 15-30cm | 0 | 0 | |||||||||||||||||
| 2017-05-24 | 144 | Avg | 30-45cm | 0 | 0 | |||||||||||||||||
| 2017-05-24 | 144 | Avg | 45-60cm | 0 | 0 |
No TZ grass heigth found
No VR grass heigth found
No VR Tree DBH found
No water potential data found
No VR Grass Biomass data found
No VR OakLeaves Biomass data found
No VR PineNeedles Biomass data found
2 photos found
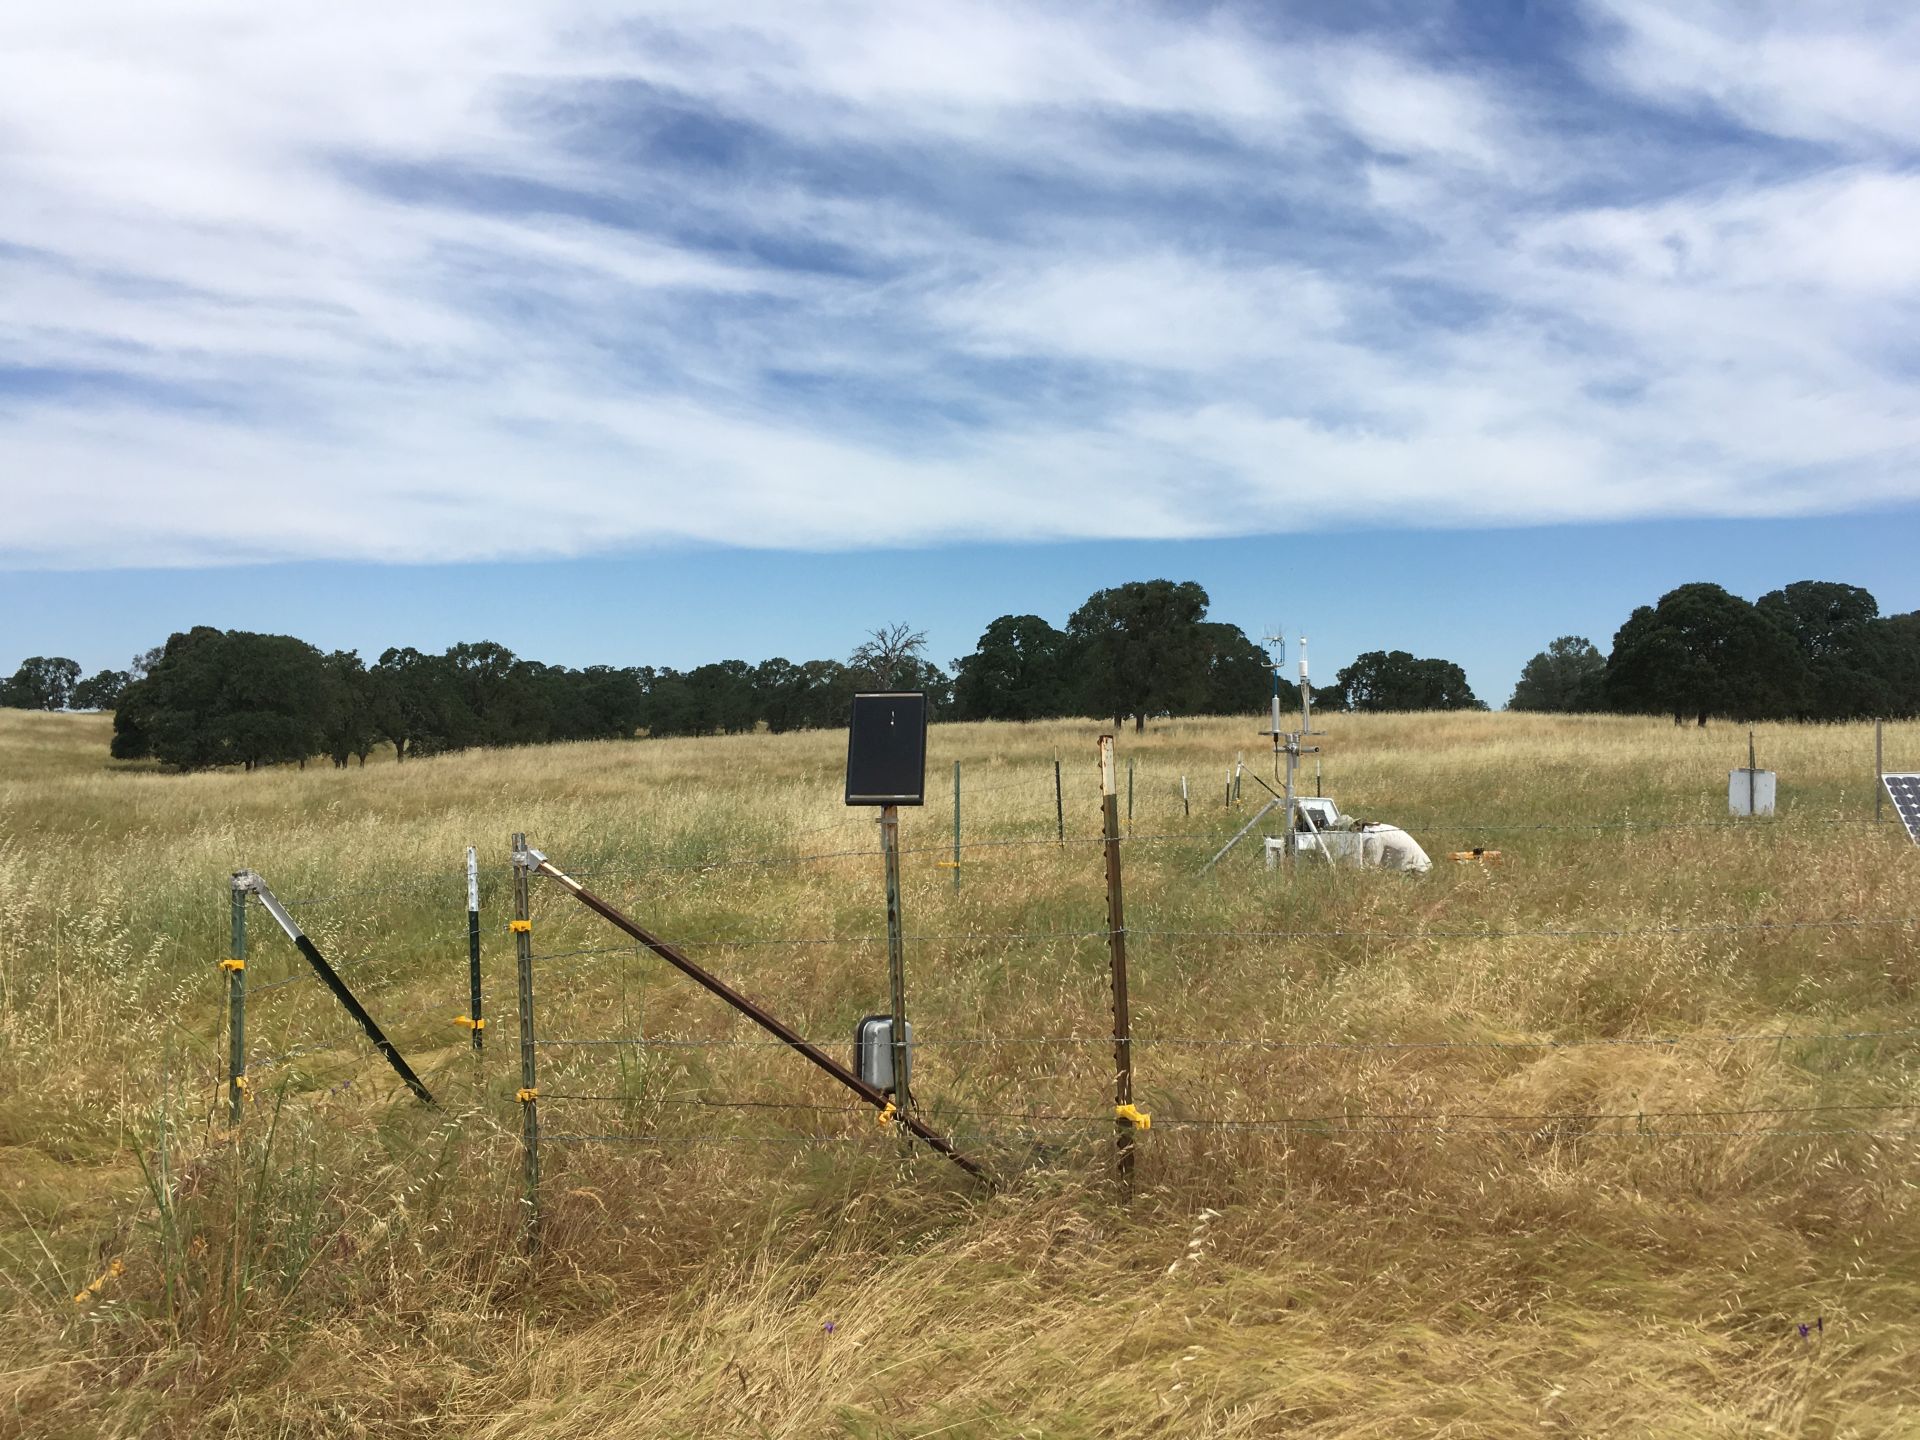
20170524VR_dryinggrass.JPG ( 2017-05-24 10:30:53 ) Full size: 1920x1440
Most of the grass had turned golden
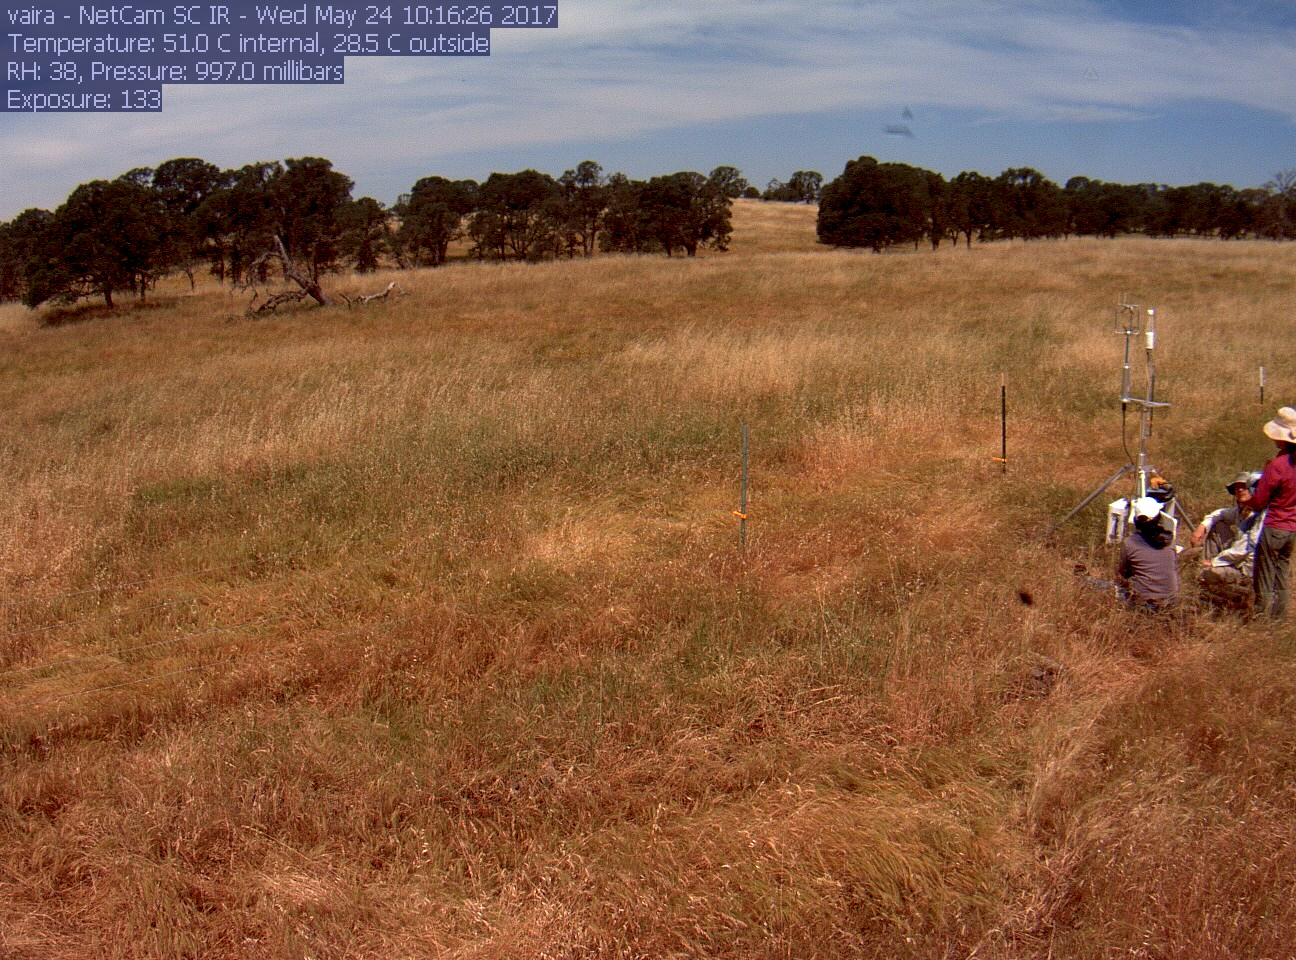
vaira_2017_05_24_101654.jpg ( 2017-05-24 09:15:28 ) Full size: 1296x960
Siyan, Joe, Daphne
9 sets found
16 VR_met graphs found
2 VR_flux graphs found
6 VR_soilco2 graphs found
2 VR_pond graphs found
Can't check TZVR_mixed
No data found for VR_fd.
No data found for VR_processed.
No data found for VR_arable.
No data found for VR_soilvue.