
Field Notes
<--2017-04-10 10:30:00 | 2017-05-11 09:00:00-->Other sites visited today: Tonzi | Tonzi
Phenocam link: Searching...
Vaira: 2017-04-24 10:00:00 (DOY 114)
Author: Joe Verfaillie
Others: Siyan
Summary: Ameriflux to take down later today, standard data collection, grass has grown a lot, tested radio link to pond, collected pond data.
| Vaira 2017-04-24 I arrived about 10:00 with Siyan. It was cool and mostly sunny. The grass has grown a lot since last time. There were puddles on the road. Ameriflux is supposed to take down their equipment today but they did not arrive while we were still at the site. We did the standard data collection including the new set of eddy equipment which we left running. Siyan did clip plots, spectral and veg height. I set up a CR10x with a Campbell radio on a 10ft pole on a fence post at the northeast corner of the cow fence. We tested the radio link to the pond. At the pond I put a radio on another 10ft pole and was able to make a connection to the CR10x we left at the tower site. I need to buy some extension cables for the radio antennas then maybe we can get the radio link set up. The pond level was 22.04ft. The water is very clear and we saw a big fish hanging out near the staff gauge. |
Veg Height (cm): Tape measure from ground to top of plant - Outside fenced area - grazed
64, 60, 62, 58, 50, 66, 63, 52, 55, 84, 61, 58, 54, 35, 30, avg = 56.8, stdev = 12.67
Field Data
No tank data
Well Depth
| Date | Location | Depth (feet) |
|---|---|---|
| 2017-04-24 | TZ_floor | 7.2 |
| 2017-04-24 | TZ_road | 17 |
| 2017-04-24 | TZ_tower | 11 |
| 2017-04-24 | VR_pond | 22.04 |
mode = both
Moisture Point Probes TZ
Array
(
[0] => Tower_1
[1] => Floor_South_1
[2] => Floor_East_1
[3] => Floor_West_1
[4] => SoilCO2_1
[5] => Soil_Transect_4_1
[6] => Soil_Transect_3_1
[7] => Soil_Transect_2_1
[8] => Soil_Transect_1_1
[9] => SoilCO2_West_A_1
[10] => SoilCO2_West_B_1
[11] => SoilCO2_West_C_1
[12] => Tower_2
[13] => Floor_South_2
[14] => Floor_East_2
[15] => Floor_West_2
[16] => Soil_Transect_4_2
[17] => Soil_Transect_3_2
[18] => Soil_Transect_2_2
[19] => Soil_Transect_1_2
[20] => SoilCO2_West_A_2
[21] => SoilCO2_West_B_2
[22] => SoilCO2_West_C_2
[23] => Tower_3
[24] => Floor_South_3
[25] => Floor_East_3
[26] => Floor_West_3
[27] => Soil_Transect_4_3
[28] => Soil_Transect_3_3
[29] => Soil_Transect_2_3
[30] => Soil_Transect_1_3
[31] => SoilCO2_West_A_3
[32] => SoilCO2_West_B_3
[33] => SoilCO2_West_C_3
[34] => Tower_4
[35] => Floor_South_4
[36] => Floor_East_4
[37] => Floor_West_4
[38] => Soil_Transect_4_4
[39] => Soil_Transect_3_4
[40] => Soil_Transect_2_4
[41] => Soil_Transect_1_4
[42] => SoilCO2_West_A_4
[43] => SoilCO2_West_B_4
[44] => SoilCO2_West_C_4
)
| Date | DOY | Rep | Depth | Tower_1 |
Floor_South_1 |
Floor_East_1 |
Floor_West_1 |
SoilCO2_1 |
Soil_Transect_4_1 |
Soil_Transect_3_1 |
Soil_Transect_2_1 |
Soil_Transect_1_1 |
SoilCO2_West_A_1 |
SoilCO2_West_B_1 |
SoilCO2_West_C_1 |
Tower_2 |
Floor_South_2 |
Floor_East_2 |
Floor_West_2 |
Soil_Transect_4_2 |
Soil_Transect_3_2 |
Soil_Transect_2_2 |
Soil_Transect_1_2 |
SoilCO2_West_A_2 |
SoilCO2_West_B_2 |
SoilCO2_West_C_2 |
Tower_3 |
Floor_South_3 |
Floor_East_3 |
Floor_West_3 |
Soil_Transect_4_3 |
Soil_Transect_3_3 |
Soil_Transect_2_3 |
Soil_Transect_1_3 |
SoilCO2_West_A_3 |
SoilCO2_West_B_3 |
SoilCO2_West_C_3 |
Tower_4 |
Floor_South_4 |
Floor_East_4 |
Floor_West_4 |
Soil_Transect_4_4 |
Soil_Transect_3_4 |
Soil_Transect_2_4 |
Soil_Transect_1_4 |
SoilCO2_West_A_4 |
SoilCO2_West_B_4 |
SoilCO2_West_C_4 |
Avg | Spacial Count |
Measurement Count |
|---|---|---|---|---|---|---|---|---|---|---|---|---|---|---|---|---|---|---|---|---|---|---|---|---|---|---|---|---|---|---|---|---|---|---|---|---|---|---|---|---|---|---|---|---|---|---|---|---|---|---|---|
| 2017-04-24 | 114 | 0 | nan | 36.7 | 31.1 | 49.9 | 33.5 | 39.9 | 34.6 | 22.9 | 25.8 | 27.3 | 25.3 | 36.4 | 35.2 | 37.8 | 35.3 | 38.1 | 38.7 | 30.4 | 31.3 | 30.4 | 21.9 | 31.6 | 24.3 | 31.6 | 36 | 43.3 | 45.2 | 39.9 | 33.5 | 31.5 | 35.4 | 33.8 | 35.4 | 34.6 | 38 | 38.8 | 54.9 | 60.9 | 46.3 | 36 | 44.8 | 50.9 | 33.7 | 46.3 | 53.1 | 47.9 | |||
| 2017-04-24 | 114 | Avg | 0-15cm | 0 | 0 | ||||||||||||||||||||||||||||||||||||||||||||||
| 2017-04-24 | 114 | Avg | 15-30cm | 0 | 0 | ||||||||||||||||||||||||||||||||||||||||||||||
| 2017-04-24 | 114 | Avg | 30-45cm | 0 | 0 | ||||||||||||||||||||||||||||||||||||||||||||||
| 2017-04-24 | 114 | Avg | 45-60cm | 0 | 0 |
mode = both
Moisture Point Probes VR
Array
(
[0] => Solar_Panels_1
[1] => Flux_Tower_1
[2] => Gate_1
[3] => Biomass_Cage_1
[4] => Solar_Panels_2
[5] => Flux_Tower_2
[6] => Gate_2
[7] => Biomass_Cage_2
[8] => Solar_Panels_3
[9] => Flux_Tower_3
[10] => Gate_3
[11] => Biomass_Cage_3
[12] => Solar_Panels_4
[13] => Flux_Tower_4
[14] => Gate_4
[15] => Biomass_Cage_4
)
| Date | DOY | Rep | Depth | Solar_Panels_1 |
Flux_Tower_1 |
Gate_1 |
Biomass_Cage_1 |
Solar_Panels_2 |
Flux_Tower_2 |
Gate_2 |
Biomass_Cage_2 |
Solar_Panels_3 |
Flux_Tower_3 |
Gate_3 |
Biomass_Cage_3 |
Solar_Panels_4 |
Flux_Tower_4 |
Gate_4 |
Biomass_Cage_4 |
Avg | Spacial Count |
Measurement Count |
|---|---|---|---|---|---|---|---|---|---|---|---|---|---|---|---|---|---|---|---|---|---|---|
| 2017-04-24 | 114 | 0 | nan | 16.2 | 22.9 | 23.5 | 10 | 28 | 28.3 | 18.7 | 18.8 | 28.8 | 15.4 | 23.5 | 28.5 | 42.8 | 29.7 | 22.8 | 33.1 | |||
| 2017-04-24 | 114 | 1 | nan | 15.3 | 22.3 | 23.8 | 9.4 | 28.3 | 28 | 19.7 | 19.1 | 29.6 | 15.4 | 22.3 | 28.8 | 42.5 | 29.9 | 2.8 | 32.8 | |||
| 2017-04-24 | 114 | Avg | 0-15cm | 0 | 0 | |||||||||||||||||
| 2017-04-24 | 114 | Avg | 15-30cm | 0 | 0 | |||||||||||||||||
| 2017-04-24 | 114 | Avg | 30-45cm | 0 | 0 | |||||||||||||||||
| 2017-04-24 | 114 | Avg | 45-60cm | 0 | 0 |
Grass Height TZ 15
| Date | Height reps (cm) | Location | Average | Samp | STDEV | ||||||||||||||
|---|---|---|---|---|---|---|---|---|---|---|---|---|---|---|---|---|---|---|---|
| 2017-04-24 | 19 | 24 | 30 | 23 | 30 | 57 | 46 | 40 | 47 | 44 | 23 | 24 | 20 | 20 | 18 | GH_ALL | 31 | 15 | 12.08 |
Grass Height VR 15
| Date | Height reps (cm) | Location | Average | Samp | STDEV | ||||||||||||||
|---|---|---|---|---|---|---|---|---|---|---|---|---|---|---|---|---|---|---|---|
| 2017-04-24 | 64 | 60 | 62 | 58 | 50 | 66 | 63 | 52 | 55 | 84 | 61 | 58 | 54 | 35 | 30 | GH_ALL | 56.8 | 15 | 12.24 |
No VR Tree DBH found
No water potential data found
No VR Grass Biomass data found
No VR OakLeaves Biomass data found
No VR PineNeedles Biomass data found
1 photos found
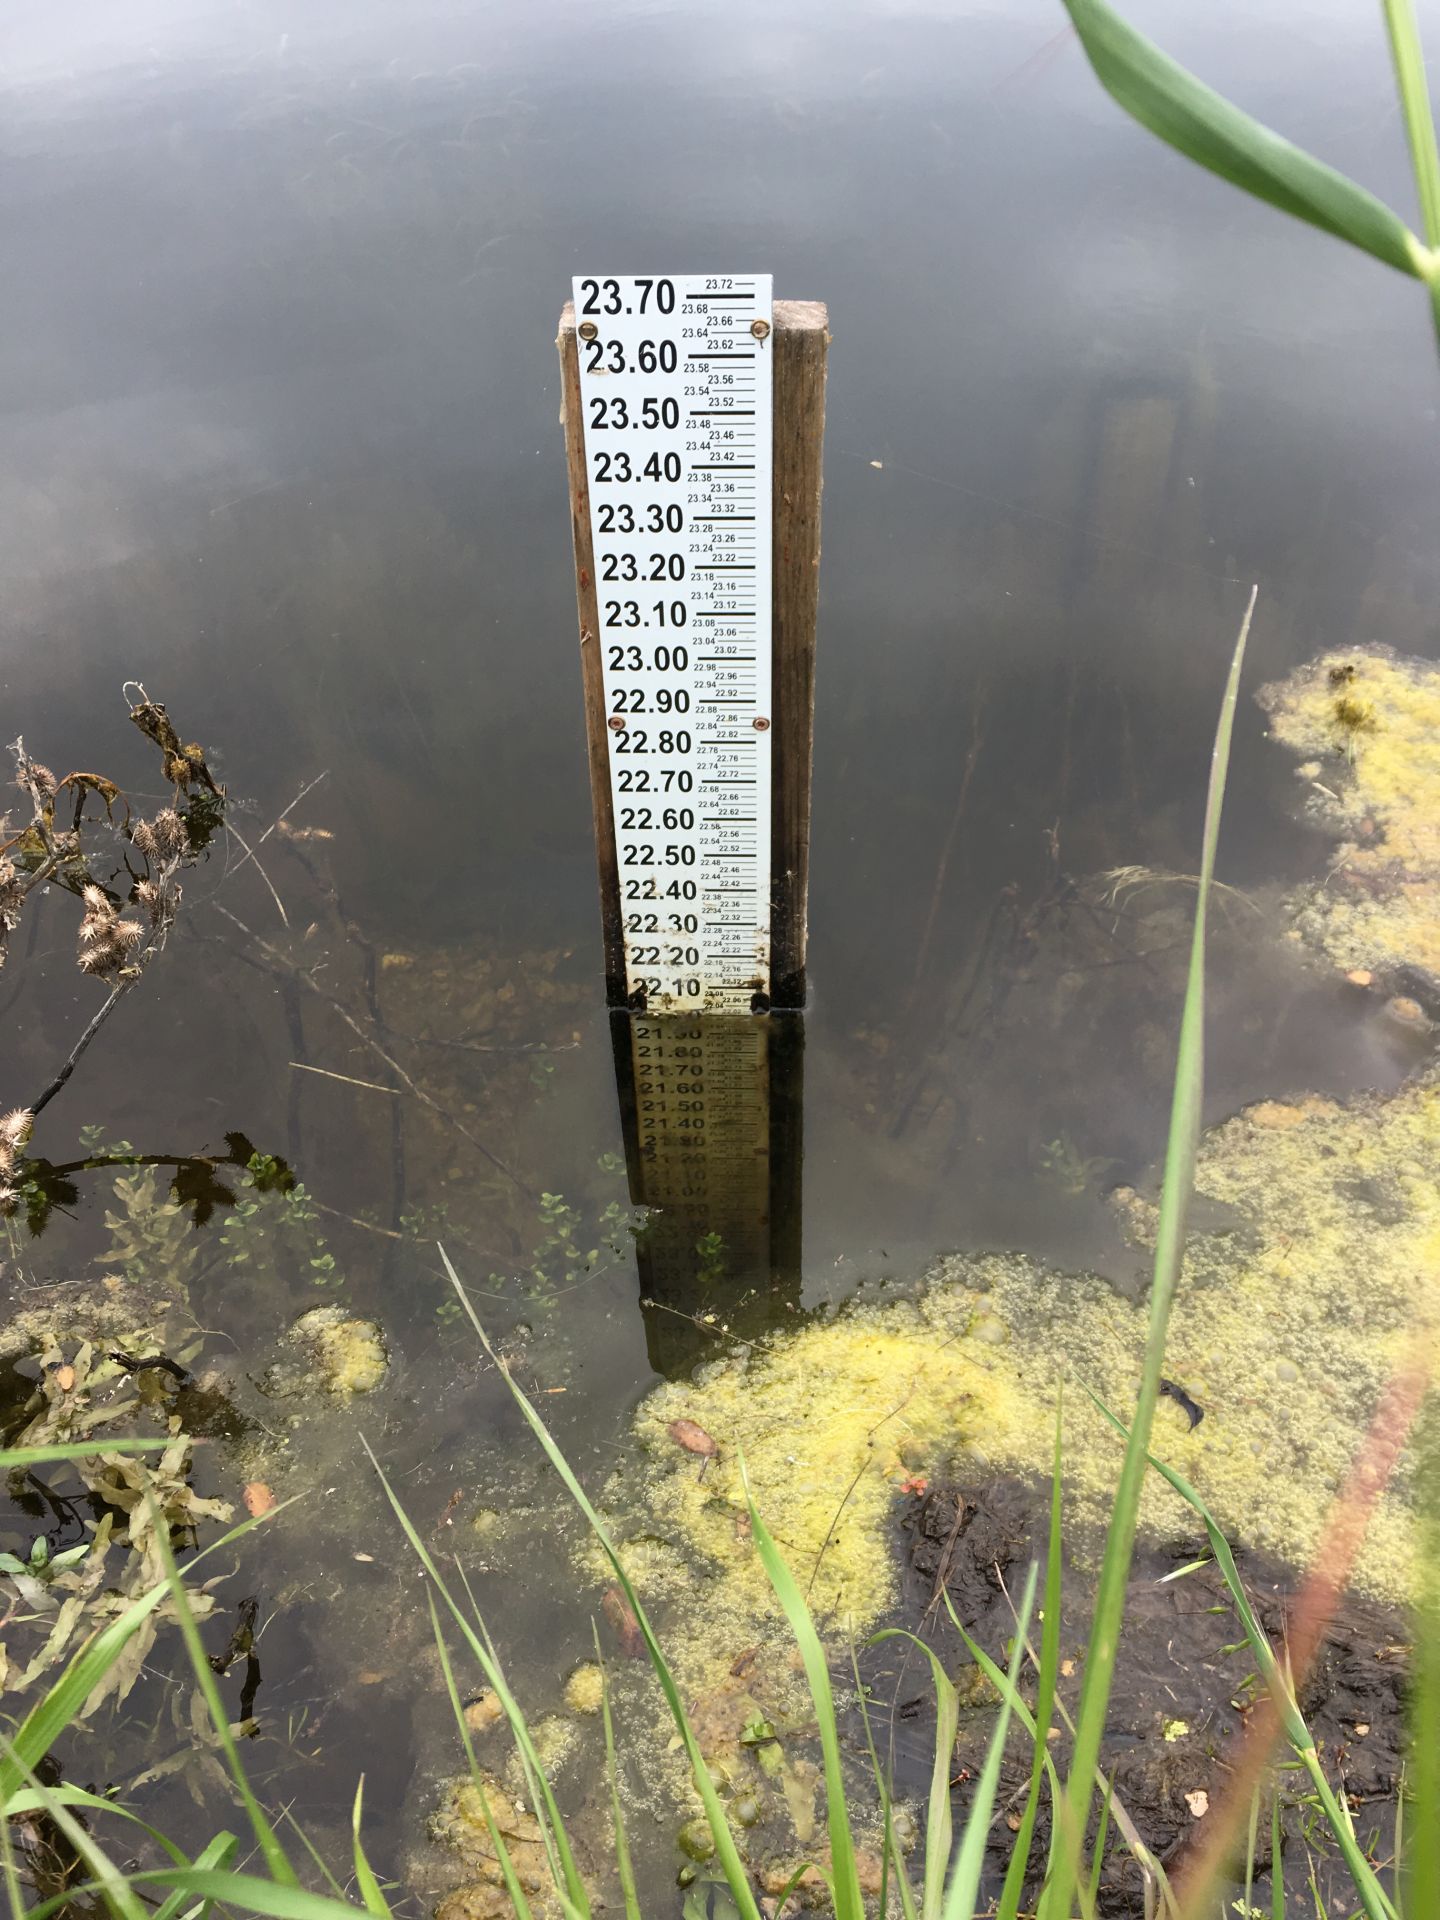
20170424VR_Pond.jpg ( 2017-04-24 11:18:30 ) Full size: 1440x1920
Staff gauge at Vaira pond reading 22.00 feet
9 sets found
16 VR_met graphs found
2 VR_flux graphs found
6 VR_soilco2 graphs found
2 VR_pond graphs found
Can't check TZVR_mixed
No data found for VR_fd.
No data found for VR_processed.
No data found for VR_arable.
No data found for VR_soilvue.