
Field Notes
<--2017-04-24 10:00:00 | 2017-05-11 09:10:00-->Other sites visited today: Tonzi | Vaira
Phenocam link: Searching...
Tonzi: 2017-04-24 11:30:00 (DOY 114)
Author: Joe Verfaillie
Others: Siyan
Summary: Standard fieldwork, midday water potential, could not collect tower met, floor met and soil moisture still one hour ahead, could not check on CR6 camera image collection.
| Tonzi 2017-04-24 I arrived about 11:30 with Siyan. There was some water in the puddles on the road. The trees here are fully leafed out now. The leaves seem bigger than usual but there are still bare twigs that have died back. No computer at the tower so I collected data from each of the data loggers directly. I could not collect data from the tower met 23x. The RS232 port looked kind of corroded and did not work. There was a trail of copper corrosion down the front of the 23x and on to the bottom of the box. I could not see where it came from. The CSIO port had a connector in it and looked okay but I could not connect that way either. The data logger seems to be running, the mux is clicking and the key pad works. Restarting the data logger gave an error “E10 95 Low Batteryâ€. The floor met and soil moister 23x still seems to have its clock one day ahead. I also wanted to check on the CR6 that we installed to collect the camera images, but had several problems. I forgot the USB cable, I had an Ethernet switch but not a third Ethernet cable. I was going to unplug the camera and plug in the laptop, but then realized the computer didn’t have the newest version of Loggernet needed for the CR6. And I did not have a micro SD card reader to check the CR6 data card. So crossing finger some more that images are getting recorded. I serviced the zcams. Siyan did midday water potential. |
Veg Height (cm): Tape measure from ground to top of plant
19, 24, 30, 23, 30, 57, 46, 40, 47, 44, 23, 24, 20, 20, 18, avg = 31, stdev = 12.51
Field Data
No tank data
Well Depth
| Date | Location | Depth (feet) |
|---|---|---|
| 2017-04-24 | TZ_floor | 7.2 |
| 2017-04-24 | TZ_road | 17 |
| 2017-04-24 | TZ_tower | 11 |
| 2017-04-24 | VR_pond | 22.04 |
mode = both
Moisture Point Probes TZ
Array
(
[0] => Tower_1
[1] => Floor_South_1
[2] => Floor_East_1
[3] => Floor_West_1
[4] => SoilCO2_1
[5] => Soil_Transect_4_1
[6] => Soil_Transect_3_1
[7] => Soil_Transect_2_1
[8] => Soil_Transect_1_1
[9] => SoilCO2_West_A_1
[10] => SoilCO2_West_B_1
[11] => SoilCO2_West_C_1
[12] => Tower_2
[13] => Floor_South_2
[14] => Floor_East_2
[15] => Floor_West_2
[16] => Soil_Transect_4_2
[17] => Soil_Transect_3_2
[18] => Soil_Transect_2_2
[19] => Soil_Transect_1_2
[20] => SoilCO2_West_A_2
[21] => SoilCO2_West_B_2
[22] => SoilCO2_West_C_2
[23] => Tower_3
[24] => Floor_South_3
[25] => Floor_East_3
[26] => Floor_West_3
[27] => Soil_Transect_4_3
[28] => Soil_Transect_3_3
[29] => Soil_Transect_2_3
[30] => Soil_Transect_1_3
[31] => SoilCO2_West_A_3
[32] => SoilCO2_West_B_3
[33] => SoilCO2_West_C_3
[34] => Tower_4
[35] => Floor_South_4
[36] => Floor_East_4
[37] => Floor_West_4
[38] => Soil_Transect_4_4
[39] => Soil_Transect_3_4
[40] => Soil_Transect_2_4
[41] => Soil_Transect_1_4
[42] => SoilCO2_West_A_4
[43] => SoilCO2_West_B_4
[44] => SoilCO2_West_C_4
)
| Date | DOY | Rep | Depth | Tower_1 |
Floor_South_1 |
Floor_East_1 |
Floor_West_1 |
SoilCO2_1 |
Soil_Transect_4_1 |
Soil_Transect_3_1 |
Soil_Transect_2_1 |
Soil_Transect_1_1 |
SoilCO2_West_A_1 |
SoilCO2_West_B_1 |
SoilCO2_West_C_1 |
Tower_2 |
Floor_South_2 |
Floor_East_2 |
Floor_West_2 |
Soil_Transect_4_2 |
Soil_Transect_3_2 |
Soil_Transect_2_2 |
Soil_Transect_1_2 |
SoilCO2_West_A_2 |
SoilCO2_West_B_2 |
SoilCO2_West_C_2 |
Tower_3 |
Floor_South_3 |
Floor_East_3 |
Floor_West_3 |
Soil_Transect_4_3 |
Soil_Transect_3_3 |
Soil_Transect_2_3 |
Soil_Transect_1_3 |
SoilCO2_West_A_3 |
SoilCO2_West_B_3 |
SoilCO2_West_C_3 |
Tower_4 |
Floor_South_4 |
Floor_East_4 |
Floor_West_4 |
Soil_Transect_4_4 |
Soil_Transect_3_4 |
Soil_Transect_2_4 |
Soil_Transect_1_4 |
SoilCO2_West_A_4 |
SoilCO2_West_B_4 |
SoilCO2_West_C_4 |
Avg | Spacial Count |
Measurement Count |
|---|---|---|---|---|---|---|---|---|---|---|---|---|---|---|---|---|---|---|---|---|---|---|---|---|---|---|---|---|---|---|---|---|---|---|---|---|---|---|---|---|---|---|---|---|---|---|---|---|---|---|---|
| 2017-04-24 | 114 | 0 | nan | 36.7 | 31.1 | 49.9 | 33.5 | 39.9 | 34.6 | 22.9 | 25.8 | 27.3 | 25.3 | 36.4 | 35.2 | 37.8 | 35.3 | 38.1 | 38.7 | 30.4 | 31.3 | 30.4 | 21.9 | 31.6 | 24.3 | 31.6 | 36 | 43.3 | 45.2 | 39.9 | 33.5 | 31.5 | 35.4 | 33.8 | 35.4 | 34.6 | 38 | 38.8 | 54.9 | 60.9 | 46.3 | 36 | 44.8 | 50.9 | 33.7 | 46.3 | 53.1 | 47.9 | |||
| 2017-04-24 | 114 | Avg | 0-15cm | 0 | 0 | ||||||||||||||||||||||||||||||||||||||||||||||
| 2017-04-24 | 114 | Avg | 15-30cm | 0 | 0 | ||||||||||||||||||||||||||||||||||||||||||||||
| 2017-04-24 | 114 | Avg | 30-45cm | 0 | 0 | ||||||||||||||||||||||||||||||||||||||||||||||
| 2017-04-24 | 114 | Avg | 45-60cm | 0 | 0 |
mode = both
Moisture Point Probes VR
Array
(
[0] => Solar_Panels_1
[1] => Flux_Tower_1
[2] => Gate_1
[3] => Biomass_Cage_1
[4] => Solar_Panels_2
[5] => Flux_Tower_2
[6] => Gate_2
[7] => Biomass_Cage_2
[8] => Solar_Panels_3
[9] => Flux_Tower_3
[10] => Gate_3
[11] => Biomass_Cage_3
[12] => Solar_Panels_4
[13] => Flux_Tower_4
[14] => Gate_4
[15] => Biomass_Cage_4
)
| Date | DOY | Rep | Depth | Solar_Panels_1 |
Flux_Tower_1 |
Gate_1 |
Biomass_Cage_1 |
Solar_Panels_2 |
Flux_Tower_2 |
Gate_2 |
Biomass_Cage_2 |
Solar_Panels_3 |
Flux_Tower_3 |
Gate_3 |
Biomass_Cage_3 |
Solar_Panels_4 |
Flux_Tower_4 |
Gate_4 |
Biomass_Cage_4 |
Avg | Spacial Count |
Measurement Count |
|---|---|---|---|---|---|---|---|---|---|---|---|---|---|---|---|---|---|---|---|---|---|---|
| 2017-04-24 | 114 | 0 | nan | 16.2 | 22.9 | 23.5 | 10 | 28 | 28.3 | 18.7 | 18.8 | 28.8 | 15.4 | 23.5 | 28.5 | 42.8 | 29.7 | 22.8 | 33.1 | |||
| 2017-04-24 | 114 | 1 | nan | 15.3 | 22.3 | 23.8 | 9.4 | 28.3 | 28 | 19.7 | 19.1 | 29.6 | 15.4 | 22.3 | 28.8 | 42.5 | 29.9 | 2.8 | 32.8 | |||
| 2017-04-24 | 114 | Avg | 0-15cm | 0 | 0 | |||||||||||||||||
| 2017-04-24 | 114 | Avg | 15-30cm | 0 | 0 | |||||||||||||||||
| 2017-04-24 | 114 | Avg | 30-45cm | 0 | 0 | |||||||||||||||||
| 2017-04-24 | 114 | Avg | 45-60cm | 0 | 0 |
Grass Height TZ 15
| Date | Height reps (cm) | Location | Average | Samp | STDEV | ||||||||||||||
|---|---|---|---|---|---|---|---|---|---|---|---|---|---|---|---|---|---|---|---|
| 2017-04-24 | 19 | 24 | 30 | 23 | 30 | 57 | 46 | 40 | 47 | 44 | 23 | 24 | 20 | 20 | 18 | GH_ALL | 31 | 15 | 12.08 |
Grass Height VR 15
| Date | Height reps (cm) | Location | Average | Samp | STDEV | ||||||||||||||
|---|---|---|---|---|---|---|---|---|---|---|---|---|---|---|---|---|---|---|---|
| 2017-04-24 | 64 | 60 | 62 | 58 | 50 | 66 | 63 | 52 | 55 | 84 | 61 | 58 | 54 | 35 | 30 | GH_ALL | 56.8 | 15 | 12.24 |
Tree DBH
| Date | Tag# | Reading (mm) |
|---|---|---|
| 2017-04-24 | 1 | 25.9 |
| 2017-04-24 | 2 | 20.6 |
| 2017-04-24 | 245 | 24.9 |
| 2017-04-24 | 3 | 22.9 |
| 2017-04-24 | 4 | 21.5 |
| 2017-04-24 | 5 | 21.9 |
| 2017-04-24 | 7 | 18.6 |
| 2017-04-24 | 72 | 23.6 |
| 2017-04-24 | 79 | 22.9 |
| 2017-04-24 | 8 | 22.0 |
Water Potential - mode: raw
| Time | Species | Tree | readings (bar) | ||
|---|---|---|---|---|---|
| 2017-04-24 13:06:00 | OAK | 102 | -6 | -6 | -7 |
| 2017-04-24 13:06:00 | OAK | 35 | -7 | -10 | -6 |
| 2017-04-24 13:06:00 | OAK | 92 | -11 | -5 | -25 |
| 2017-04-24 13:36:00 | PINE | OLD | -14 | -15 | -17 |
| 2017-04-24 13:36:00 | PINE | YNG | -2 | -4 | -6 |
No TZ Grass Biomass data found
No TZ OakLeaves Biomass data found
No TZ PineNeedles Biomass data found
1 photos found
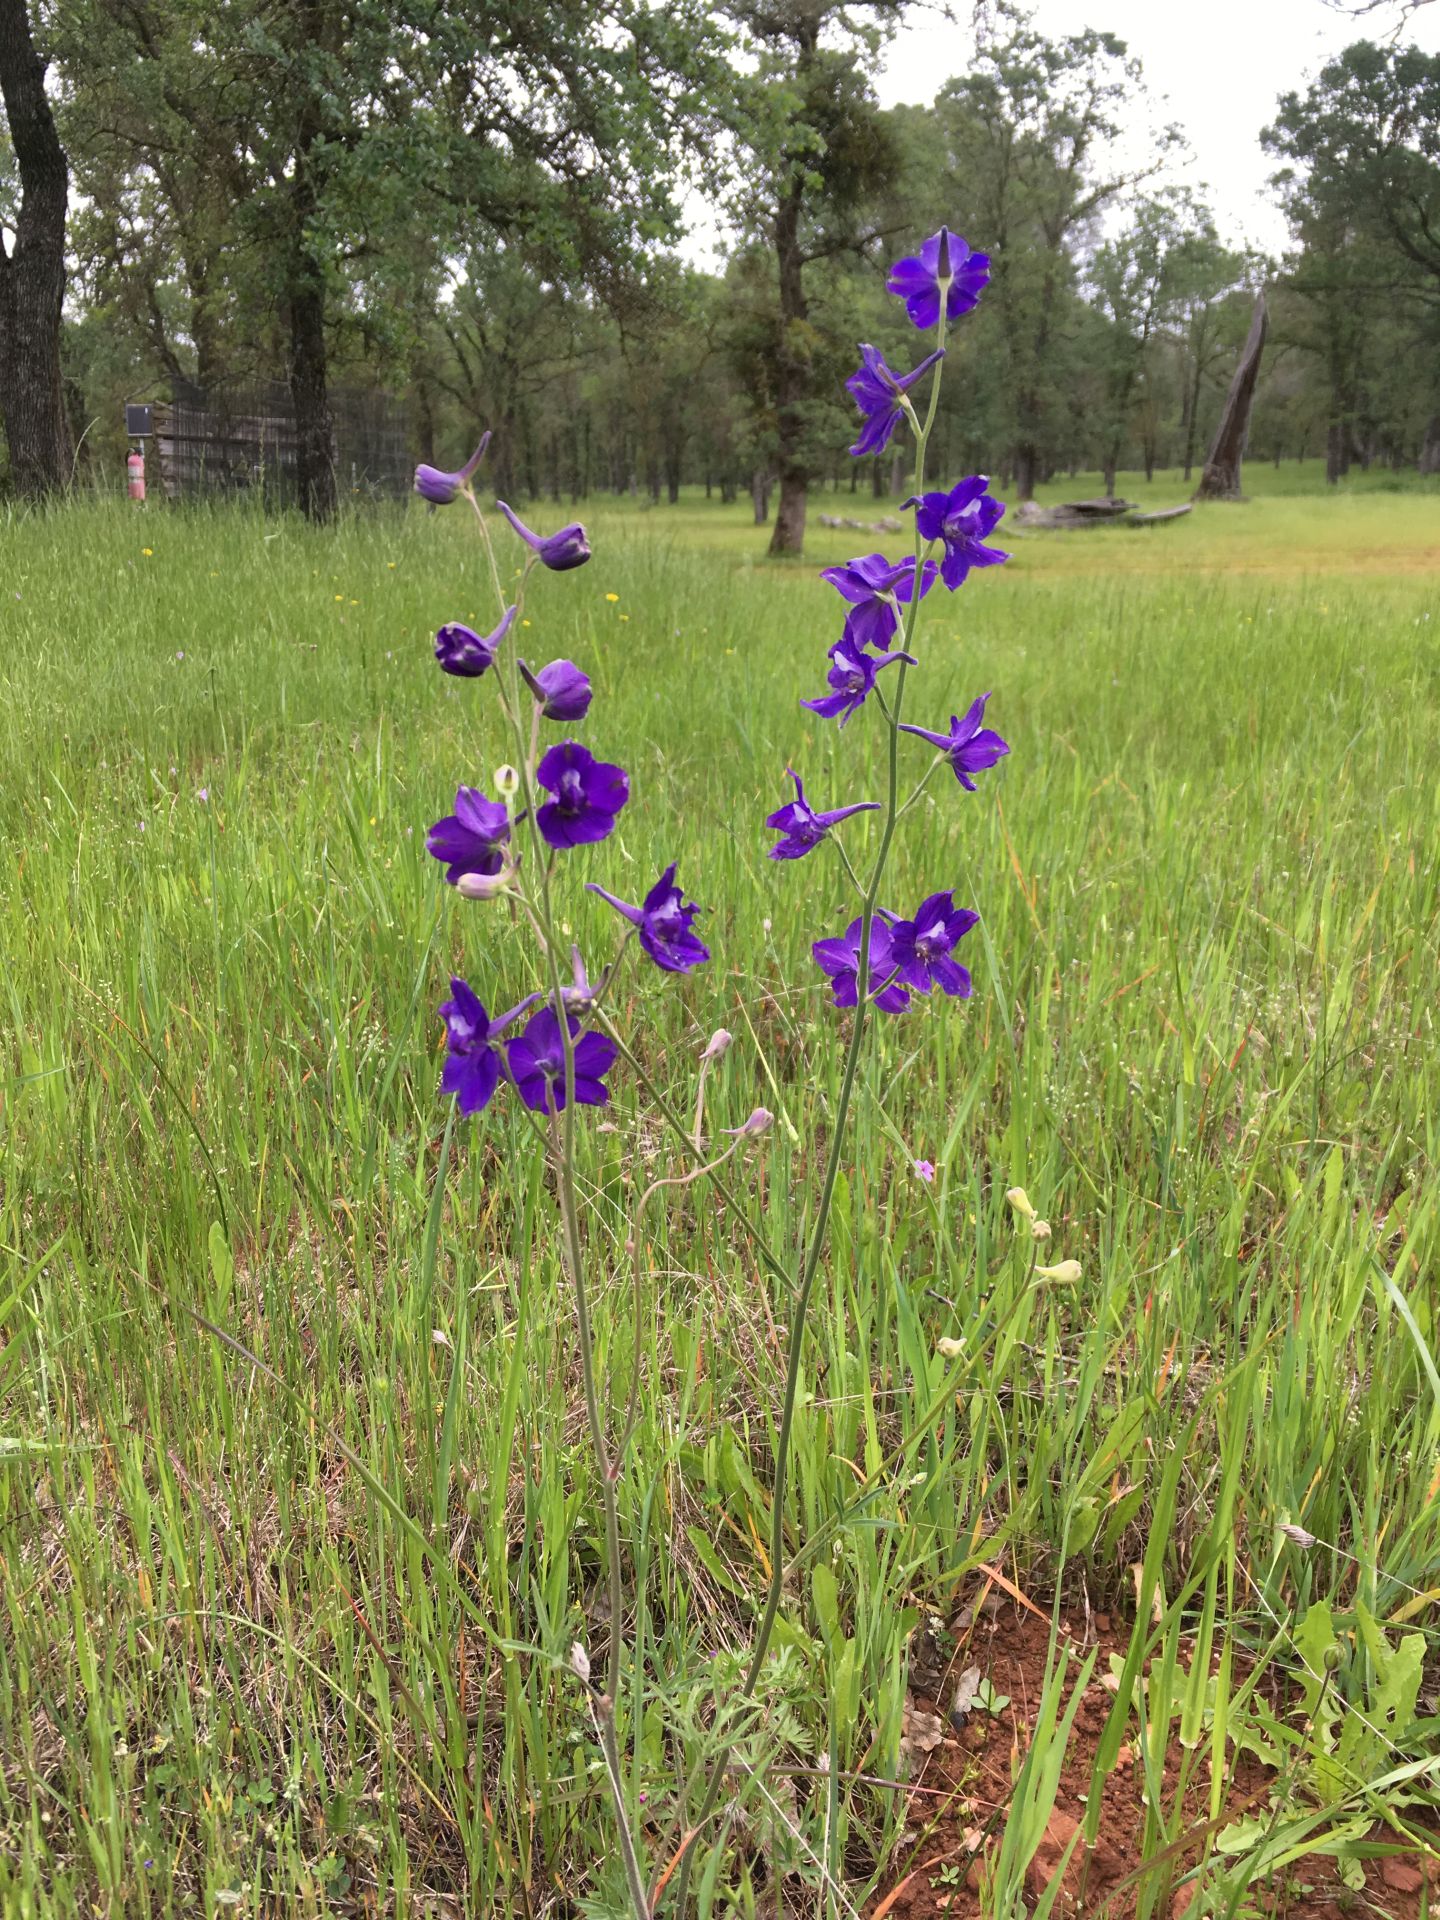
20170424TZ_Flowers.jpg ( 2017-04-24 11:52:43 ) Full size: 1440x1920
Larkspur - purple flower
16 sets found
No data found for TZ_Fenergy.
11 TZ_tmet graphs found
11 TZ_soilco2 graphs found
Can't check TZ_mixed
3 TZ_mixed graphs found
1 TZ_fflux graphs found
8 TZ_fmet graphs found
No data found for TZ_tram.
No data found for TZ_co2prof.
1 TZ_irt graphs found
No data found for TZ_windprof.
1 TZ_tflux graphs found
2 TZ_sm graphs found
Can't check TZ_met
1 TZ_met graphs found
Can't check TZVR_mixed
No data found for TZ_osu.
No data found for TZ_fd.
Tonzi Z-cam data