
Field Notes
<--2017-03-02 10:30:00 | 2017-03-16 09:00:00-->Other sites visited today: Vaira | Tonzi
Phenocam link: Searching...
Tonzi: 2017-03-02 10:30:00 (DOY 61)
Author: Joe Verfaillie
Others: Siyan
Summary: Moved MD9 units around, zcam 3 fell over - fixed, brought in Campbell wireless link, fixed IRT ground sensor mount.
| Tonzi 2017-03-02 I arrived with Siyan about 10:30. The pond is about as full as I’ve seen it. The low spots were soggy. A bunch of young cows around. The grass is green but some of it looks gray or brown like it got frosted. No leaves on trees yet. I tried to connect the Floor flux system to the Tower. I removed the MD9 base unit from the Floor system and moved it to the soil moisture box near the Tower. There I disconnected the line to the Tower and put the base unit on that end. I removed remote unit #2 from the box where the soil temperature AM25T is and move it to the Floor in place of where the base unit was. I was able to connect to the MD9 network with the laptop, but could not connect with the Tower computer. It may be that I need more than three pins for the RS232 connection. I left things as they were and will test MD9 units in the lab. Also it might not be possible to connect a CR1000 to a MD9 network. The soil co2 system was not connecting over the wireless units. I restarted the units, the data logger and the tower computer with no success. I remove sn 21520 from the soil co2 box and sn 21519 from the Tower computer box and brought the units into the lab for testing. I was hoping to use them at Vaira for the pond and connect the TZ soil co2 system with the MD9 network. Zcam #3 near the Floor tower had fallen over due to its wooden stake rotting. I pounded in a small metal fence post and strapped the wooded stake to it. I fixed a broken wire on the soil co2 fence. The ground IRT sensor was knocked out of its mount. I remounted it. The tree IRT sensor looks a little off center – I will need a latter to adjust it. The tree has a bunch of mistletoe in it. |
Field Data
No tank data
Well Depth
| Date | Location | Depth (feet) |
|---|---|---|
| 2017-03-02 | TZ_floor | 14.3 |
| 2017-03-02 | TZ_road | 27.1 |
| 2017-03-02 | TZ_tower | 16.8 |
| 2017-03-02 | VR_pond | 22.26 |
mode = both
Moisture Point Probes TZ
Array
(
[0] => Tower_1
[1] => Floor_South_1
[2] => Floor_East_1
[3] => Floor_West_1
[4] => Soil_Transect_4_1
[5] => Soil_Transect_3_1
[6] => Soil_Transect_2_1
[7] => Soil_Transect_1_1
[8] => SoilCO2_West_A_1
[9] => SoilCO2_West_B_1
[10] => SoilCO2_West_C_1
[11] => Tower_2
[12] => Floor_South_2
[13] => Floor_East_2
[14] => Floor_West_2
[15] => Soil_Transect_4_2
[16] => Soil_Transect_3_2
[17] => Soil_Transect_2_2
[18] => Soil_Transect_1_2
[19] => SoilCO2_West_A_2
[20] => SoilCO2_West_B_2
[21] => SoilCO2_West_C_2
[22] => Tower_3
[23] => Floor_South_3
[24] => Floor_East_3
[25] => Floor_West_3
[26] => Soil_Transect_4_3
[27] => Soil_Transect_3_3
[28] => Soil_Transect_2_3
[29] => Soil_Transect_1_3
[30] => SoilCO2_West_A_3
[31] => SoilCO2_West_B_3
[32] => SoilCO2_West_C_3
[33] => Tower_4
[34] => Floor_South_4
[35] => Floor_East_4
[36] => Floor_West_4
[37] => Soil_Transect_4_4
[38] => Soil_Transect_3_4
[39] => Soil_Transect_2_4
[40] => Soil_Transect_1_4
[41] => SoilCO2_West_A_4
[42] => SoilCO2_West_B_4
[43] => SoilCO2_West_C_4
)
| Date | DOY | Rep | Depth | Tower_1 |
Floor_South_1 |
Floor_East_1 |
Floor_West_1 |
Soil_Transect_4_1 |
Soil_Transect_3_1 |
Soil_Transect_2_1 |
Soil_Transect_1_1 |
SoilCO2_West_A_1 |
SoilCO2_West_B_1 |
SoilCO2_West_C_1 |
Tower_2 |
Floor_South_2 |
Floor_East_2 |
Floor_West_2 |
Soil_Transect_4_2 |
Soil_Transect_3_2 |
Soil_Transect_2_2 |
Soil_Transect_1_2 |
SoilCO2_West_A_2 |
SoilCO2_West_B_2 |
SoilCO2_West_C_2 |
Tower_3 |
Floor_South_3 |
Floor_East_3 |
Floor_West_3 |
Soil_Transect_4_3 |
Soil_Transect_3_3 |
Soil_Transect_2_3 |
Soil_Transect_1_3 |
SoilCO2_West_A_3 |
SoilCO2_West_B_3 |
SoilCO2_West_C_3 |
Tower_4 |
Floor_South_4 |
Floor_East_4 |
Floor_West_4 |
Soil_Transect_4_4 |
Soil_Transect_3_4 |
Soil_Transect_2_4 |
Soil_Transect_1_4 |
SoilCO2_West_A_4 |
SoilCO2_West_B_4 |
SoilCO2_West_C_4 |
Avg | Spacial Count |
Measurement Count |
|---|---|---|---|---|---|---|---|---|---|---|---|---|---|---|---|---|---|---|---|---|---|---|---|---|---|---|---|---|---|---|---|---|---|---|---|---|---|---|---|---|---|---|---|---|---|---|---|---|---|---|
| 2017-03-02 | 61 | 0 | nan | 39.3 | 27.6 | 39.9 | 38.2 | 36.1 | 21.4 | 28.5 | 36.4 | 35.2 | 34.9 | 35.5 | 41.7 | 43.6 | 38.4 | 40.8 | 33.5 | 32.6 | 32.3 | 25.2 | 31.3 | 25.8 | 32.6 | 38.6 | 43.5 | 39.6 | 42.4 | 36.3 | 32.4 | 37.7 | 35.7 | 36.6 | 39.1 | 39.9 | 40 | 56.6 | 41.4 | 45.1 | 35.1 | 45.4 | 48.3 | 37.7 | 45.4 | 51.4 | 48.6 | |||
| 2017-03-02 | 61 | 1 | nan | 38.4 | 24.7 | 39.9 | 38.2 | 35.2 | 21.4 | 27.6 | 35.8 | 36.1 | 34.3 | 36.4 | 42.3 | 43.9 | 39.9 | 41.4 | 32.3 | 31.9 | 32.3 | 24.9 | 31.6 | 25.9 | 33.2 | 38.5 | 42.7 | 39.6 | 43.3 | 36.6 | 32.7 | 36.6 | 36.3 | 36.6 | 39.4 | 39.4 | 38.8 | 56.3 | 41.4 | 45.4 | 35.7 | 45.7 | 49.4 | 36.2 | 45 | 51.1 | 49.1 | |||
| 2017-03-02 | 61 | Avg | 0-15cm | 0 | 0 | |||||||||||||||||||||||||||||||||||||||||||||
| 2017-03-02 | 61 | Avg | 15-30cm | 0 | 0 | |||||||||||||||||||||||||||||||||||||||||||||
| 2017-03-02 | 61 | Avg | 30-45cm | 0 | 0 | |||||||||||||||||||||||||||||||||||||||||||||
| 2017-03-02 | 61 | Avg | 45-60cm | 0 | 0 |
mode = both
Moisture Point Probes VR
Array
(
[0] => Solar_Panels_1
[1] => Flux_Tower_1
[2] => Gate_1
[3] => Biomass_Cage_1
[4] => Solar_Panels_2
[5] => Flux_Tower_2
[6] => Gate_2
[7] => Biomass_Cage_2
[8] => Solar_Panels_3
[9] => Flux_Tower_3
[10] => Gate_3
[11] => Biomass_Cage_3
[12] => Solar_Panels_4
[13] => Flux_Tower_4
[14] => Gate_4
[15] => Biomass_Cage_4
)
| Date | DOY | Rep | Depth | Solar_Panels_1 |
Flux_Tower_1 |
Gate_1 |
Biomass_Cage_1 |
Solar_Panels_2 |
Flux_Tower_2 |
Gate_2 |
Biomass_Cage_2 |
Solar_Panels_3 |
Flux_Tower_3 |
Gate_3 |
Biomass_Cage_3 |
Solar_Panels_4 |
Flux_Tower_4 |
Gate_4 |
Biomass_Cage_4 |
Avg | Spacial Count |
Measurement Count |
|---|---|---|---|---|---|---|---|---|---|---|---|---|---|---|---|---|---|---|---|---|---|---|
| 2017-03-02 | 61 | 0 | nan | 30.2 | 21.2 | 31.4 | 9.7 | 29.5 | 34.4 | 19.1 | 21.6 | 36.8 | 24.8 | 24.6 | 32.1 | 38.2 | 19.1 | 21.6 | 32.6 | |||
| 2017-03-02 | 61 | 1 | nan | 29.7 | 31.1 | 9.1 | 29.8 | 32.4 | 19.4 | 21.3 | 36.8 | 23.9 | 24 | 31.3 | 38.5 | 20.8 | 21.9 | 33.7 | ||||
| 2017-03-02 | 61 | Avg | 0-15cm | 0 | 0 | |||||||||||||||||
| 2017-03-02 | 61 | Avg | 15-30cm | 0 | 0 | |||||||||||||||||
| 2017-03-02 | 61 | Avg | 30-45cm | 0 | 0 | |||||||||||||||||
| 2017-03-02 | 61 | Avg | 45-60cm | 0 | 0 |
No TZ grass heigth found
No VR grass heigth found
Tree DBH
| Date | Tag# | Reading (mm) |
|---|---|---|
| 2017-03-02 | 1 | 25.5 |
| 2017-03-02 | 102 | 23.0 |
| 2017-03-02 | 2 | 19.9 |
| 2017-03-02 | 245 | 23.3 |
| 2017-03-02 | 3 | 23.9 |
| 2017-03-02 | 4 | 20.0 |
| 2017-03-02 | 5 | 21.1 |
| 2017-03-02 | 7 | 17.7 |
| 2017-03-02 | 72 | 23.5 |
| 2017-03-02 | 79 | 22.8 |
| 2017-03-02 | 8 | 21.0 |
No water potential data found
No TZ Grass Biomass data found
No TZ OakLeaves Biomass data found
No TZ PineNeedles Biomass data found
1 photos found
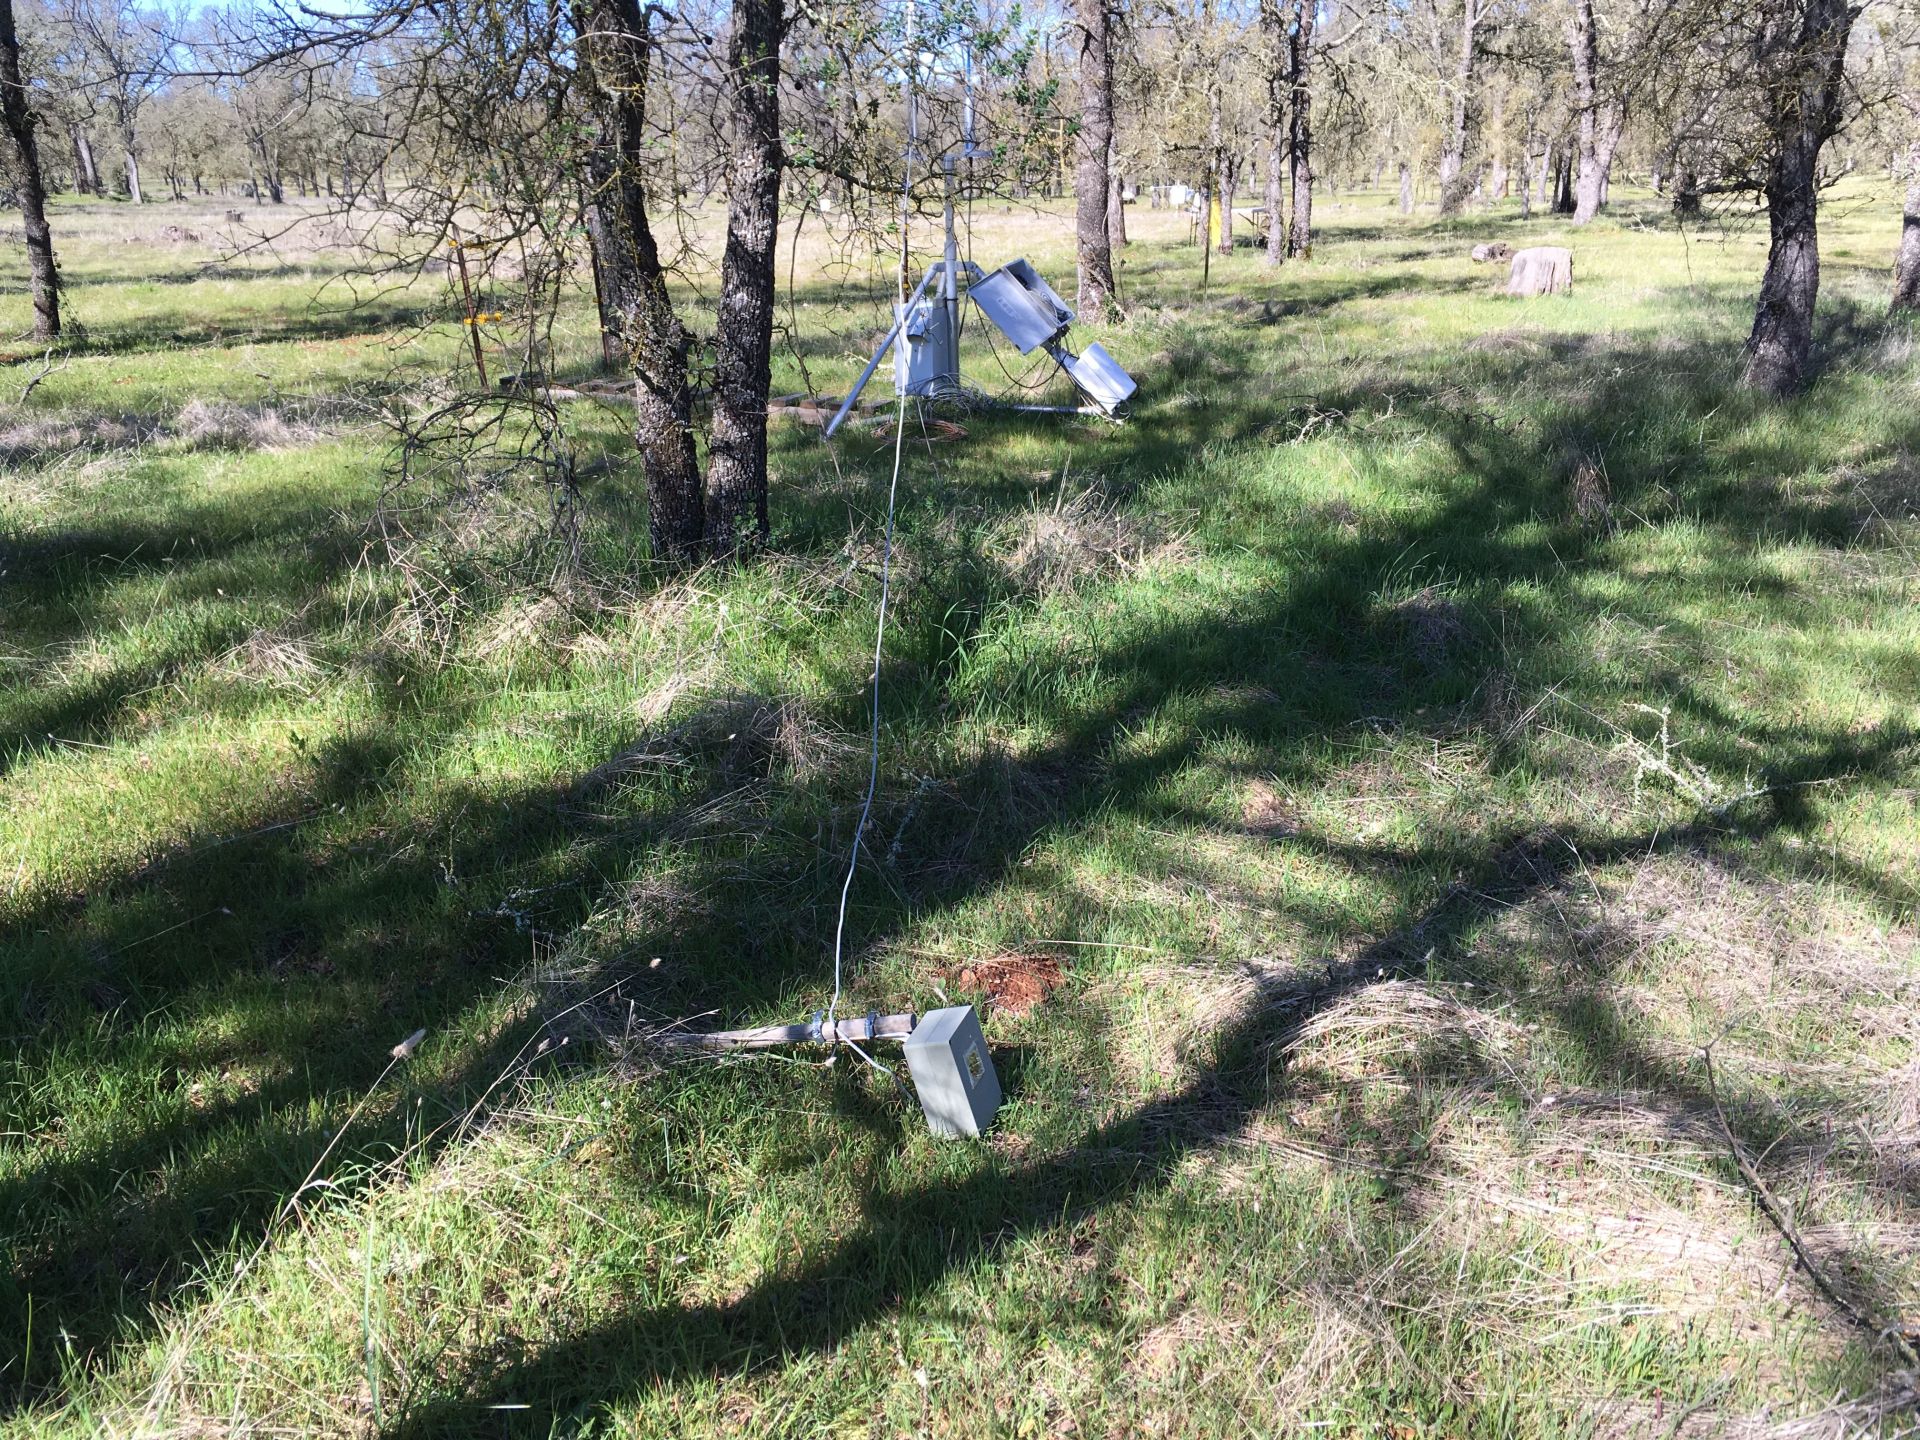
20170302TZ_Zcam3Down.jpg ( 2017-03-02 10:41:35 ) Full size: 1920x1440
Z-cam 3 fell over
16 sets found
No data found for TZ_Fenergy.
11 TZ_tmet graphs found
11 TZ_soilco2 graphs found
Can't check TZ_mixed
3 TZ_mixed graphs found
1 TZ_fflux graphs found
8 TZ_fmet graphs found
No data found for TZ_tram.
No data found for TZ_co2prof.
1 TZ_irt graphs found
No data found for TZ_windprof.
1 TZ_tflux graphs found
2 TZ_sm graphs found
Can't check TZ_met
1 TZ_met graphs found
Can't check TZVR_mixed
No data found for TZ_osu.
No data found for TZ_fd.
Tonzi Z-cam data