
Field Notes
<--2017-03-02 13:00:00 | 2017-04-05 10:30:00-->Other sites visited today: Tonzi | Tonzi
Phenocam link: Searching...
Vaira: 2017-03-16 09:00:00 (DOY 75)
Author: Joe Verfaillie
Others: Siyan
Summary: Foggy early, the trees have leaves, standard fieldwork
| Vaira 2017-03-16 I arrived about 9am with Siyan. It was foggy at first but burned off quickly and was mostly sunny with little wind. The trees are starting to put on leaves. The grass looks like it is starting to really grow and there are a few flowers. The road in mostly dry. We did the standard fieldwork. All looked well, Siyan did clip plots. I cleaned the radiometers. We did not go to the pond. |
Field Data
No tank data
Well Depth
| Date | Location | Depth (feet) |
|---|---|---|
| 2017-03-16 | TZ_floor | 12.8 |
| 2017-03-16 | TZ_road | 21.5 |
| 2017-03-16 | TZ_tower | 15.6 |
mode = both
Moisture Point Probes TZ
Array
(
[0] => Tower_1
[1] => Floor_South_1
[2] => Floor_East_1
[3] => Floor_West_1
[4] => SoilCO2_1
[5] => Soil_Transect_4_1
[6] => Soil_Transect_3_1
[7] => Soil_Transect_2_1
[8] => Soil_Transect_1_1
[9] => SoilCO2_West_A_1
[10] => SoilCO2_West_B_1
[11] => SoilCO2_West_C_1
[12] => Tower_2
[13] => Floor_South_2
[14] => Floor_East_2
[15] => Floor_West_2
[16] => SoilCO2_2
[17] => Soil_Transect_4_2
[18] => Soil_Transect_3_2
[19] => Soil_Transect_2_2
[20] => Soil_Transect_1_2
[21] => SoilCO2_West_A_2
[22] => SoilCO2_West_B_2
[23] => SoilCO2_West_C_2
[24] => Tower_3
[25] => Floor_South_3
[26] => Floor_East_3
[27] => Floor_West_3
[28] => SoilCO2_3
[29] => Soil_Transect_4_3
[30] => Soil_Transect_3_3
[31] => Soil_Transect_2_3
[32] => Soil_Transect_1_3
[33] => SoilCO2_West_A_3
[34] => SoilCO2_West_B_3
[35] => SoilCO2_West_C_3
[36] => Tower_4
[37] => Floor_South_4
[38] => Floor_East_4
[39] => Floor_West_4
[40] => SoilCO2_4
[41] => Soil_Transect_4_4
[42] => Soil_Transect_3_4
[43] => Soil_Transect_2_4
[44] => Soil_Transect_1_4
[45] => SoilCO2_West_A_4
[46] => SoilCO2_West_B_4
[47] => SoilCO2_West_C_4
)
| Date | DOY | Rep | Depth | Tower_1 |
Floor_South_1 |
Floor_East_1 |
Floor_West_1 |
SoilCO2_1 |
Soil_Transect_4_1 |
Soil_Transect_3_1 |
Soil_Transect_2_1 |
Soil_Transect_1_1 |
SoilCO2_West_A_1 |
SoilCO2_West_B_1 |
SoilCO2_West_C_1 |
Tower_2 |
Floor_South_2 |
Floor_East_2 |
Floor_West_2 |
SoilCO2_2 |
Soil_Transect_4_2 |
Soil_Transect_3_2 |
Soil_Transect_2_2 |
Soil_Transect_1_2 |
SoilCO2_West_A_2 |
SoilCO2_West_B_2 |
SoilCO2_West_C_2 |
Tower_3 |
Floor_South_3 |
Floor_East_3 |
Floor_West_3 |
SoilCO2_3 |
Soil_Transect_4_3 |
Soil_Transect_3_3 |
Soil_Transect_2_3 |
Soil_Transect_1_3 |
SoilCO2_West_A_3 |
SoilCO2_West_B_3 |
SoilCO2_West_C_3 |
Tower_4 |
Floor_South_4 |
Floor_East_4 |
Floor_West_4 |
SoilCO2_4 |
Soil_Transect_4_4 |
Soil_Transect_3_4 |
Soil_Transect_2_4 |
Soil_Transect_1_4 |
SoilCO2_West_A_4 |
SoilCO2_West_B_4 |
SoilCO2_West_C_4 |
Avg | Spacial Count |
Measurement Count |
|---|---|---|---|---|---|---|---|---|---|---|---|---|---|---|---|---|---|---|---|---|---|---|---|---|---|---|---|---|---|---|---|---|---|---|---|---|---|---|---|---|---|---|---|---|---|---|---|---|---|---|---|---|---|---|
| 2017-03-16 | 75 | 0 | nan | 35.2 | 30.5 | 41.1 | 34.9 | 39.9 | 33.8 | 16.5 | 24.8 | 29.1 | 31.1 | 31.4 | 32 | 38.1 | 40.8 | 38.7 | 38.1 | 50 | 30.1 | 30.4 | 30.1 | 2.3 | 30.7 | 23.1 | 30.4 | 33.2 | 43.3 | 40.5 | 42.1 | 39.6 | 32.7 | 30.4 | 34.6 | 34.6 | 34.5 | 34.6 | 38.5 | 39.4 | 53.4 | 59.2 | 46 | 41.4 | 35.4 | 43.1 | 49.1 | 32.8 | 45.4 | 50.3 | 50 | |||
| 2017-03-16 | 75 | 1 | nan | 35.2 | 34.1 | 40.8 | 34.6 | 39.9 | 34.1 | 16.5 | 24.1 | 28.8 | 31.4 | 31.4 | 31.7 | 38.7 | 40.5 | 38.7 | 38.1 | 50 | 29.8 | 31 | 30.7 | 21 | 30.1 | 23.4 | 30.4 | 32.7 | 43.5 | 40.7 | 41.6 | 39.6 | 31.3 | 30.7 | 35.2 | 34.6 | 35.7 | 35.4 | 38.5 | 39.7 | 54 | 58.9 | 46.3 | 41.4 | 35.4 | 43.4 | 50 | 33.1 | 45.7 | 50.3 | 50.3 | |||
| 2017-03-16 | 75 | Avg | 0-15cm | 0 | 0 | |||||||||||||||||||||||||||||||||||||||||||||||||
| 2017-03-16 | 75 | Avg | 15-30cm | 0 | 0 | |||||||||||||||||||||||||||||||||||||||||||||||||
| 2017-03-16 | 75 | Avg | 30-45cm | 0 | 0 | |||||||||||||||||||||||||||||||||||||||||||||||||
| 2017-03-16 | 75 | Avg | 45-60cm | 0 | 0 |
mode = both
Moisture Point Probes VR
Array
(
[0] => Solar_Panels_1
[1] => Flux_Tower_1
[2] => Gate_1
[3] => Biomass_Cage_1
[4] => Solar_Panels_2
[5] => Flux_Tower_2
[6] => Gate_2
[7] => Biomass_Cage_2
[8] => Solar_Panels_3
[9] => Flux_Tower_3
[10] => Gate_3
[11] => Biomass_Cage_3
[12] => Solar_Panels_4
[13] => Flux_Tower_4
[14] => Gate_4
[15] => Biomass_Cage_4
)
| Date | DOY | Rep | Depth | Solar_Panels_1 |
Flux_Tower_1 |
Gate_1 |
Biomass_Cage_1 |
Solar_Panels_2 |
Flux_Tower_2 |
Gate_2 |
Biomass_Cage_2 |
Solar_Panels_3 |
Flux_Tower_3 |
Gate_3 |
Biomass_Cage_3 |
Solar_Panels_4 |
Flux_Tower_4 |
Gate_4 |
Biomass_Cage_4 |
Avg | Spacial Count |
Measurement Count |
|---|---|---|---|---|---|---|---|---|---|---|---|---|---|---|---|---|---|---|---|---|---|---|
| 2017-03-16 | 75 | 0 | nan | 20 | 20.6 | 20.9 | 5.3 | 27.1 | 27.4 | 19.7 | 17.9 | 29.9 | 20.9 | 25.1 | 29.1 | 36.5 | 27.6 | 18.5 | 30.5 | |||
| 2017-03-16 | 75 | 1 | nan | 21.2 | 21.7 | 8.6 | 5.6 | 25.5 | 27.4 | 19.7 | 18.2 | 28.2 | 14 | 25.1 | 31 | 40.5 | 27.9 | 18.8 | 28.8 | |||
| 2017-03-16 | 75 | Avg | 0-15cm | 0 | 0 | |||||||||||||||||
| 2017-03-16 | 75 | Avg | 15-30cm | 0 | 0 | |||||||||||||||||
| 2017-03-16 | 75 | Avg | 30-45cm | 0 | 0 | |||||||||||||||||
| 2017-03-16 | 75 | Avg | 45-60cm | 0 | 0 |
No TZ grass heigth found
No VR grass heigth found
No VR Tree DBH found
No water potential data found
No VR Grass Biomass data found
No VR OakLeaves Biomass data found
No VR PineNeedles Biomass data found
2 photos found

20170316VR_SiyanFromTrees.jpg ( 2017-03-16 09:40:09 ) Full size: 1920x1440
Siyan taking clip plots
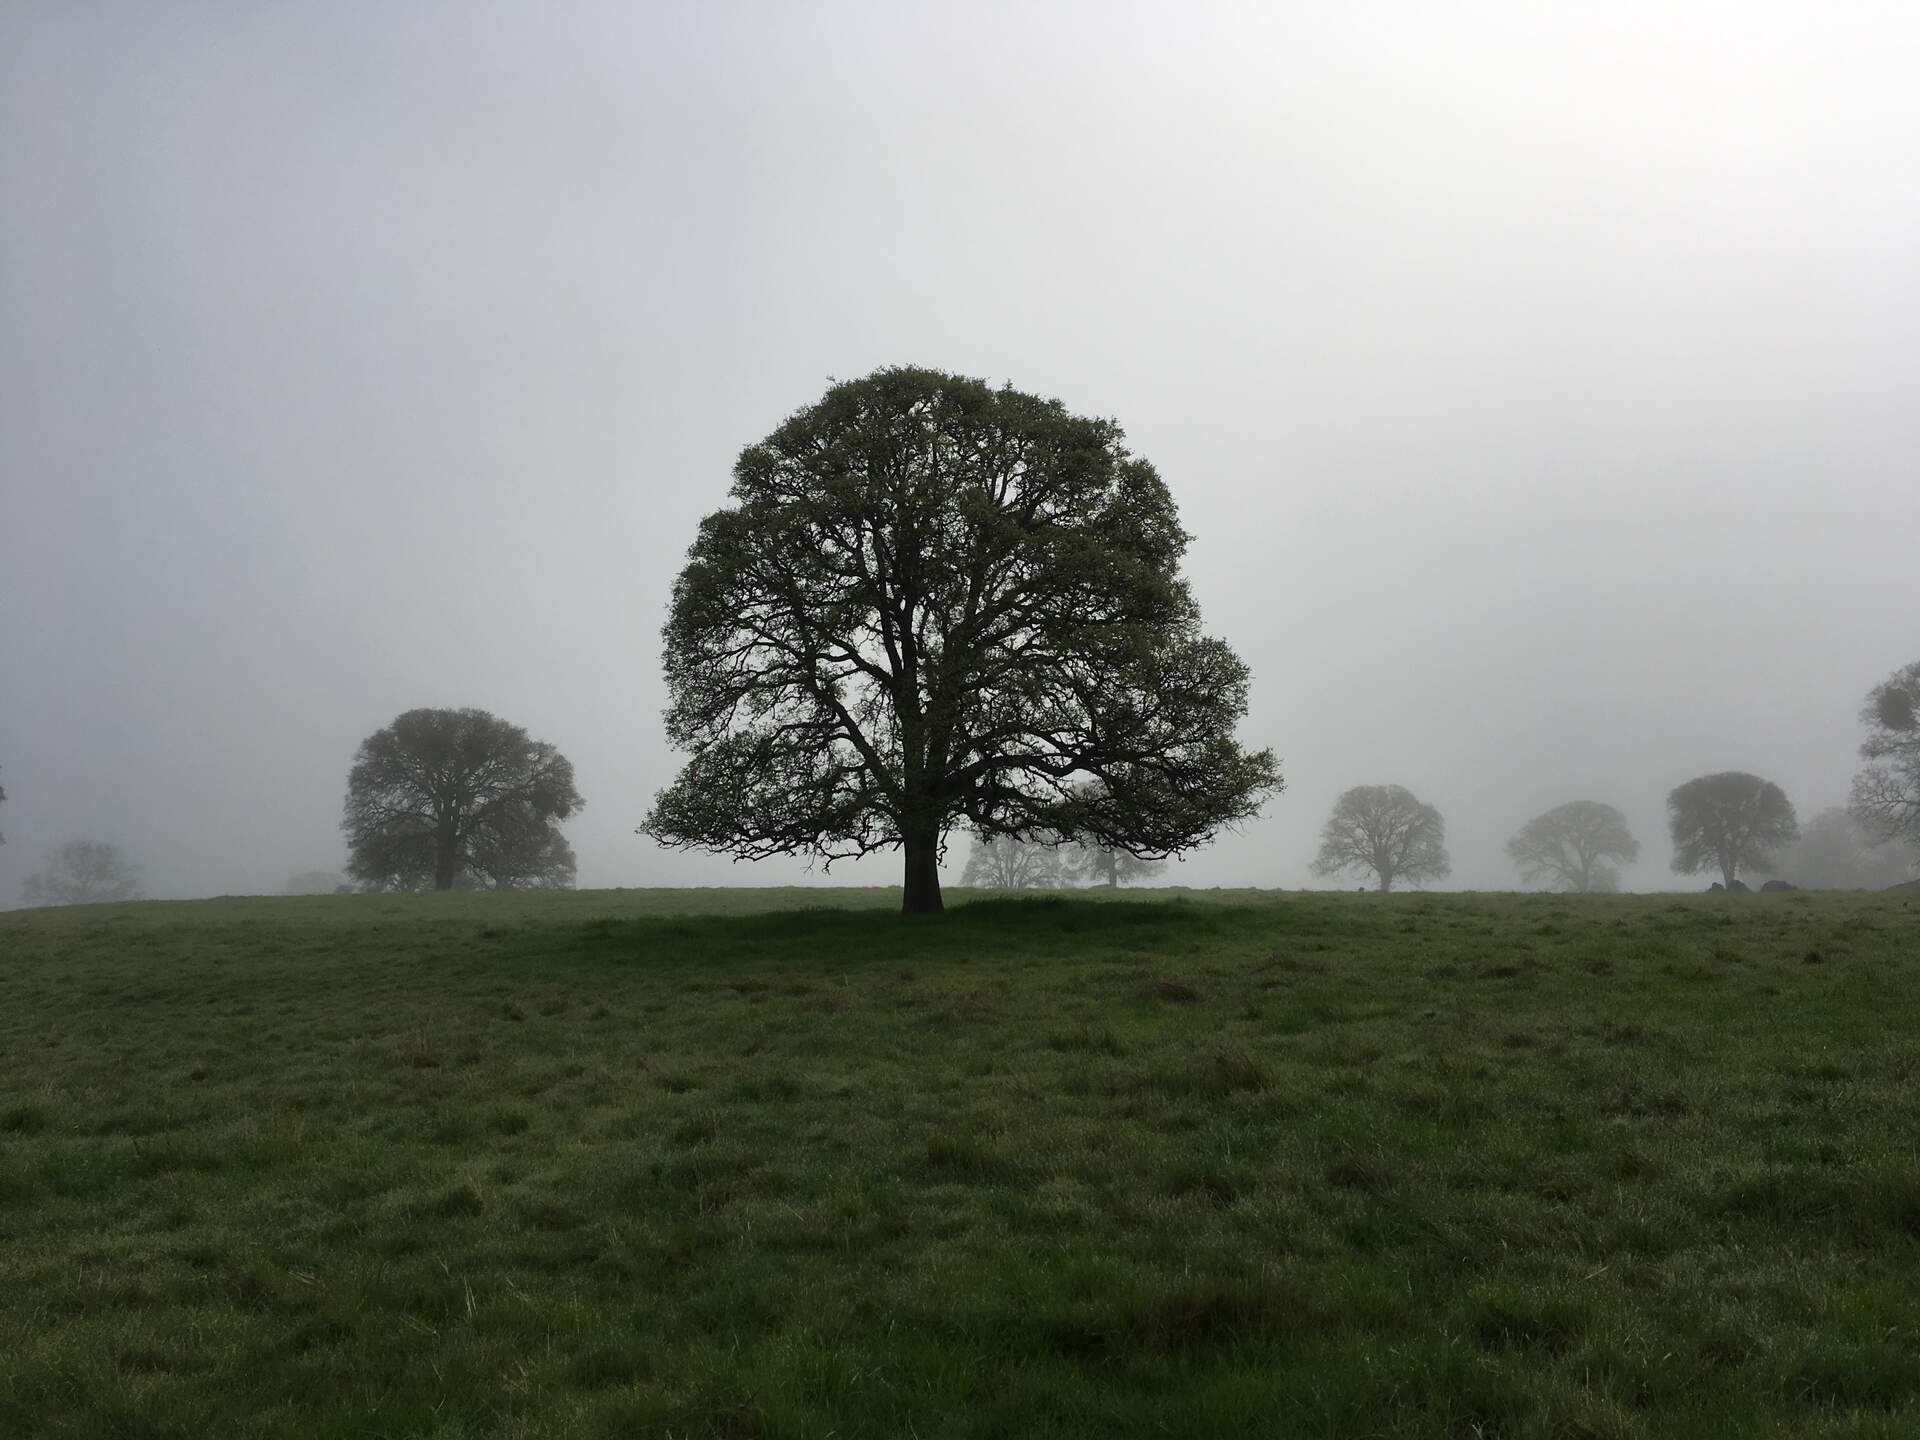
20170316VR_IconTree.jpg ( 2017-03-16 00:00:00 ) Full size: 1920x1440
Biomet Lab iconic tree in fog
9 sets found
16 VR_met graphs found
2 VR_flux graphs found
6 VR_soilco2 graphs found
2 VR_pond graphs found
Can't check TZVR_mixed
No data found for VR_fd.
No data found for VR_processed.
No data found for VR_arable.
No data found for VR_soilvue.