
Field Notes
<--2016-12-27 09:00:00 | 2017-01-17 12:25:00-->Other sites visited today: Mayberry | Sherman Wetland | Twitchell Rice | Twitchell Alfalfa | West Pond | Bouldin Alfalfa
Phenocam link: Searching...
East End: 2017-01-05 12:20:00 (DOY 5)
Author: Daphne Szutu
Others: Sam Chamberlain, Kyle Hemes
Summary: Regular data collection, large blowdown of wetland tule/cattail
| We arrived around 12:20pm. There was large blowdown of wetland tule/cattail between the solar panels and tower. Also looks like patches of blown over reeds everywhere. We downloaded met data (connecting to CR1000 directly through USB-serial cable) and USB GHG data. I connected to the blue ethernet cable and used TightVNC Viewer to remote-desktop into the tower computer and transfer the camera data to the field laptop. No camera data between 12/21 and 12/26. We cleaned the radiation, CO2, and CH4 sensors. We refilled the wash reservoir; it was only 1/4 full. The 7500 read: CO2 431ppm (this is similar to TA but is about 20ppm higher than the other Delta sites) H2O 308mmol/m T 9.3C P 101.7kPa SS 100.2 --> 101.2 after cleaning The 7700 read: CH4 1.96ppm RSSI 50.9 --> 78.0 after cleaning |
2 photos found
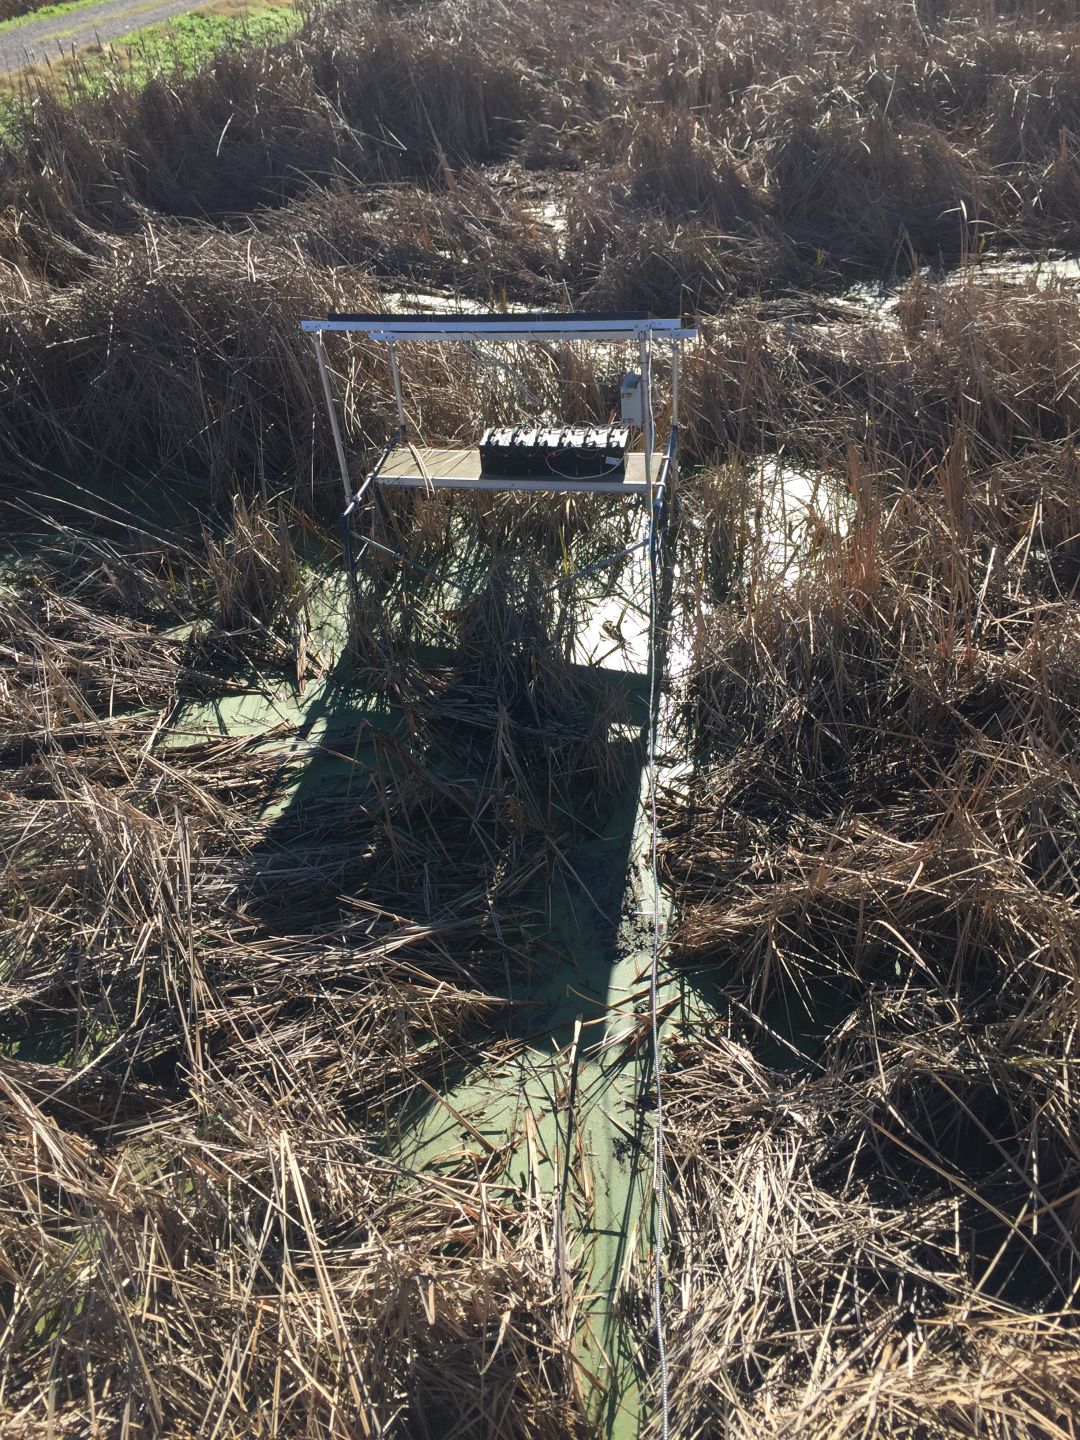
20170106EE_blowdown2.JPG ( 2017-01-05 12:14:56 ) Full size: 1080x1440
Blowdown around the East End solar scaffolding
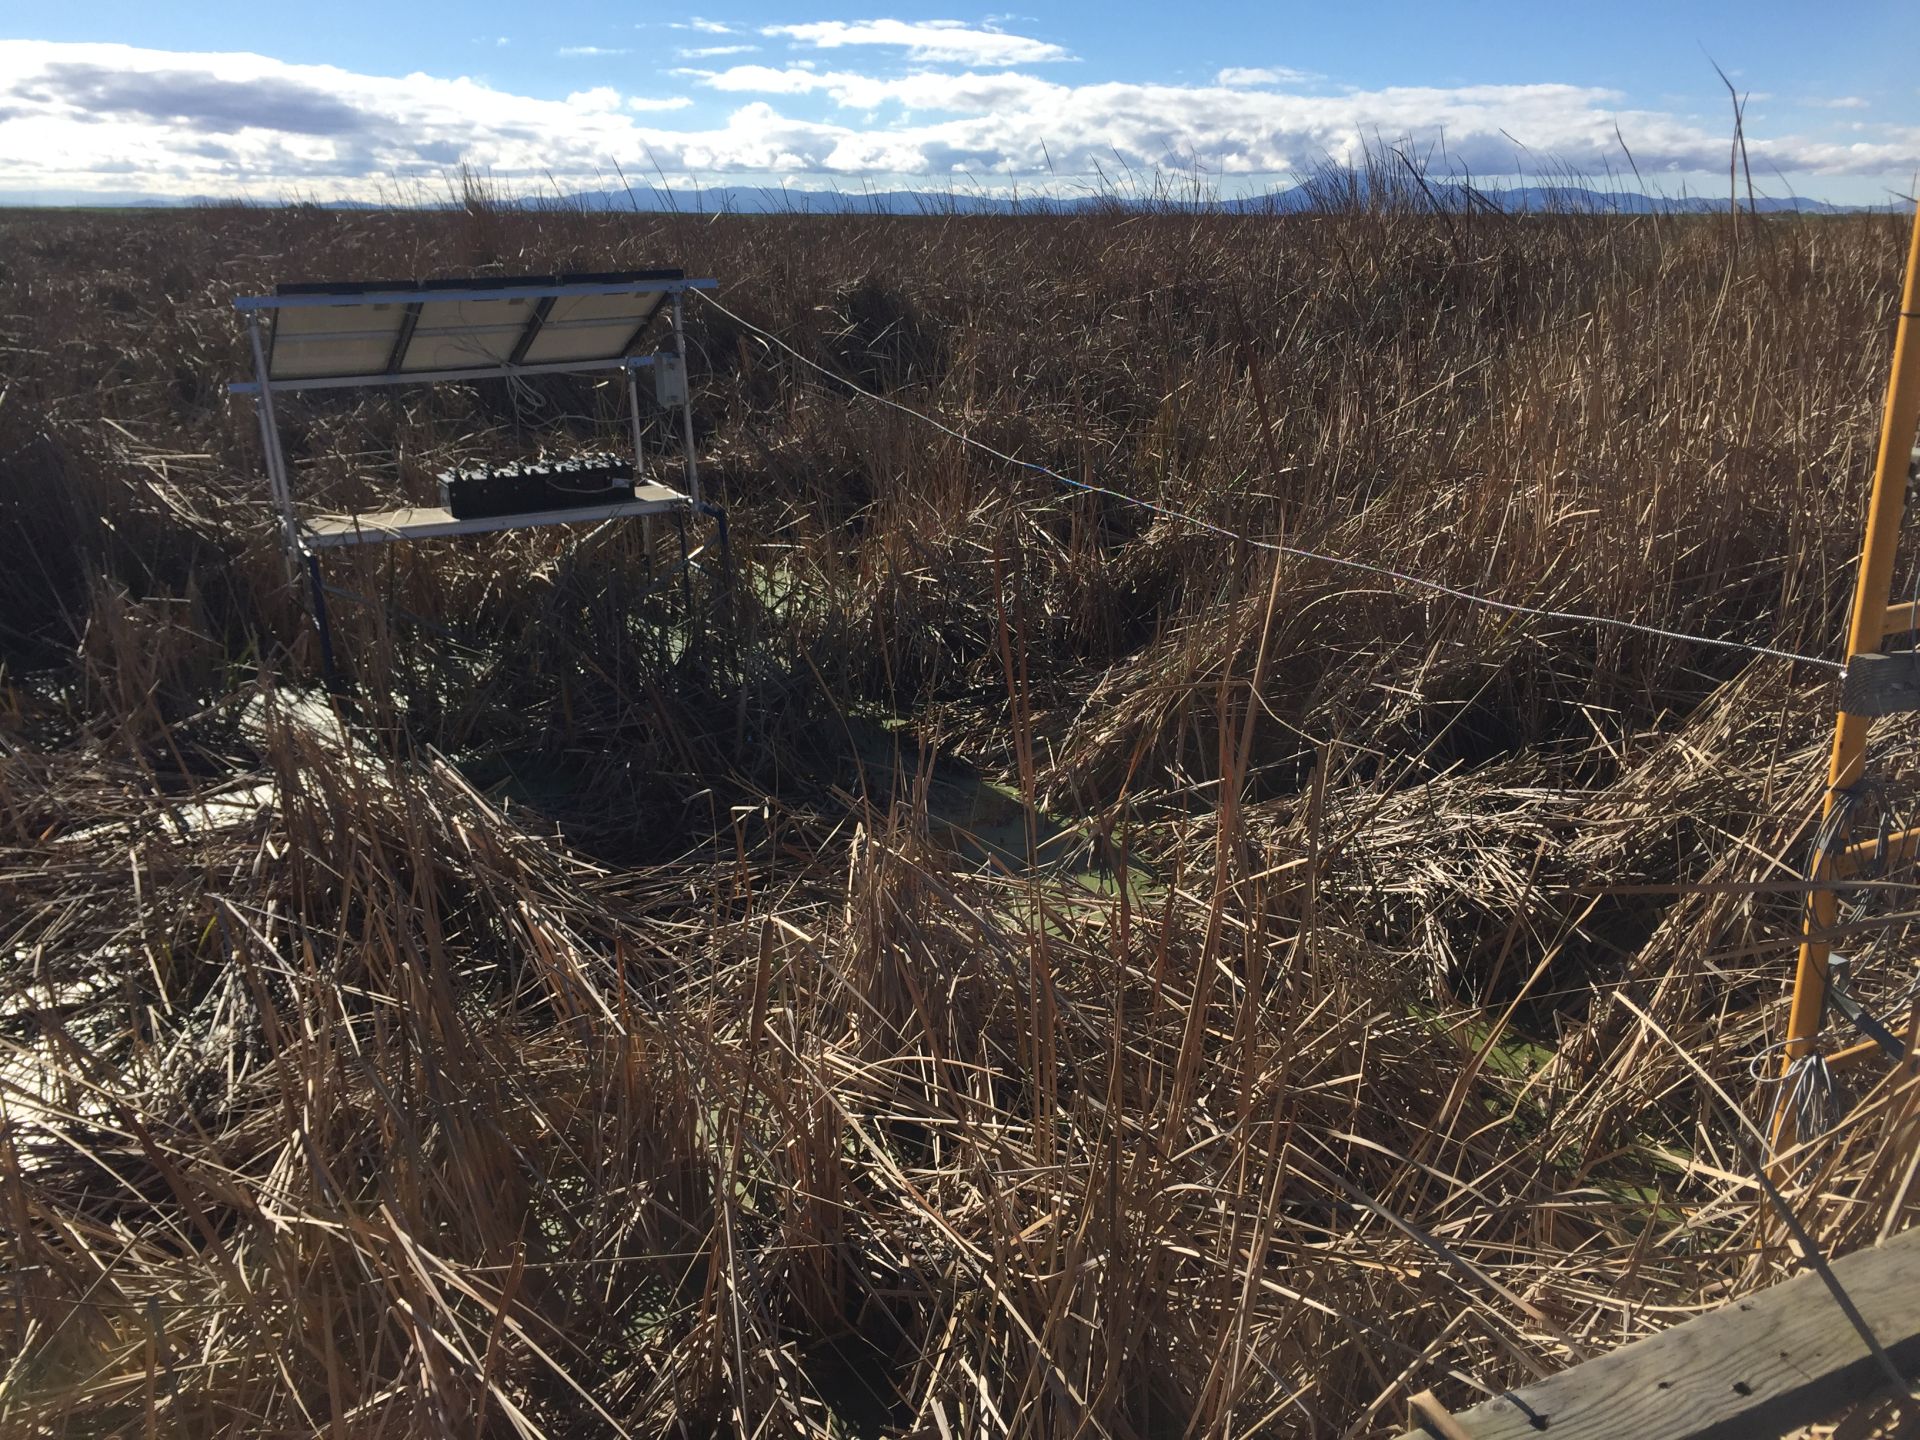
20170106EE_blowdown1.JPG ( 2017-01-05 12:02:42 ) Full size: 1920x1440
Blowdown at East End between the tower and the solar scaffolding
11 sets found
14 EE_met graphs found
Can't check EE_mixed
1 EE_mixed graphs found
8 EE_flux graphs found
Can't check MBWPEESWGT_mixed
1 EE_cam graphs found
Can't check MBEEWPSWEPGT_cam
Can't check SIMBTWEE_met
Can't check EE_Temp
5 EE_Temp graphs found
Can't check EE_minidot
1 EE_minidot graphs found
Can't check MBSWEEWPBCBA
1 EE_processed graphs found