
Field Notes
<--2016-09-22 13:30:00 | 2016-10-11 12:30:00-->Other sites visited today: Sherman Wetland | Mayberry | Twitchell Rice | West Pond | Twitchell Alfalfa
Phenocam link: Searching...
East End: 2016-09-29 11:20:00 (DOY 273)
Author: Joe Verfaillie
Others: Dennis, Kyle, Sam
Summary: Measured reflectance, installed compute stick, modem and Stardot, remove Canon
| East End 2016-09-29 I arrived about 11:20 with Dennis, Kyle and Sam. It was clear, sunny and warm. The 7500 read: 405.4ppm CO2, 738mmol/m3 H2O, 21.9C, 101.6kPa, 92.5SS – 100.5 after cleaning The 7700 read: 2.02ppm CH4, 44.2RSSI – 80.0 after cleaning Dennis did spectral reflectance at the boardwalk to the north of the tower site. He Did: Reference, dark, sample down, sample up, sample down, sample up …reference, dark. I added a compute stick and swapped the Canon camera for a Stardot sn 0030F4D214A3. I put new connectors on the Ethernet cable I installed last time but it still did not work. The one I did in the lab worked and I was able to get the connectors through the bulkheads so we can use that one for now. I did not remove the defective one or tie down the working one – next time. The Quatech serial box and AT&T modem both were set up and seemed to work. Crossing my fingers. It’s still kind of a mess. I think it will be better to use an Ethernet switch eventually. I forgot to add the power switch for the Stardot so it is on all the time. The pressure sensors sn H0160069 ran fine in the lab so I reinstalled it. |
1 photos found
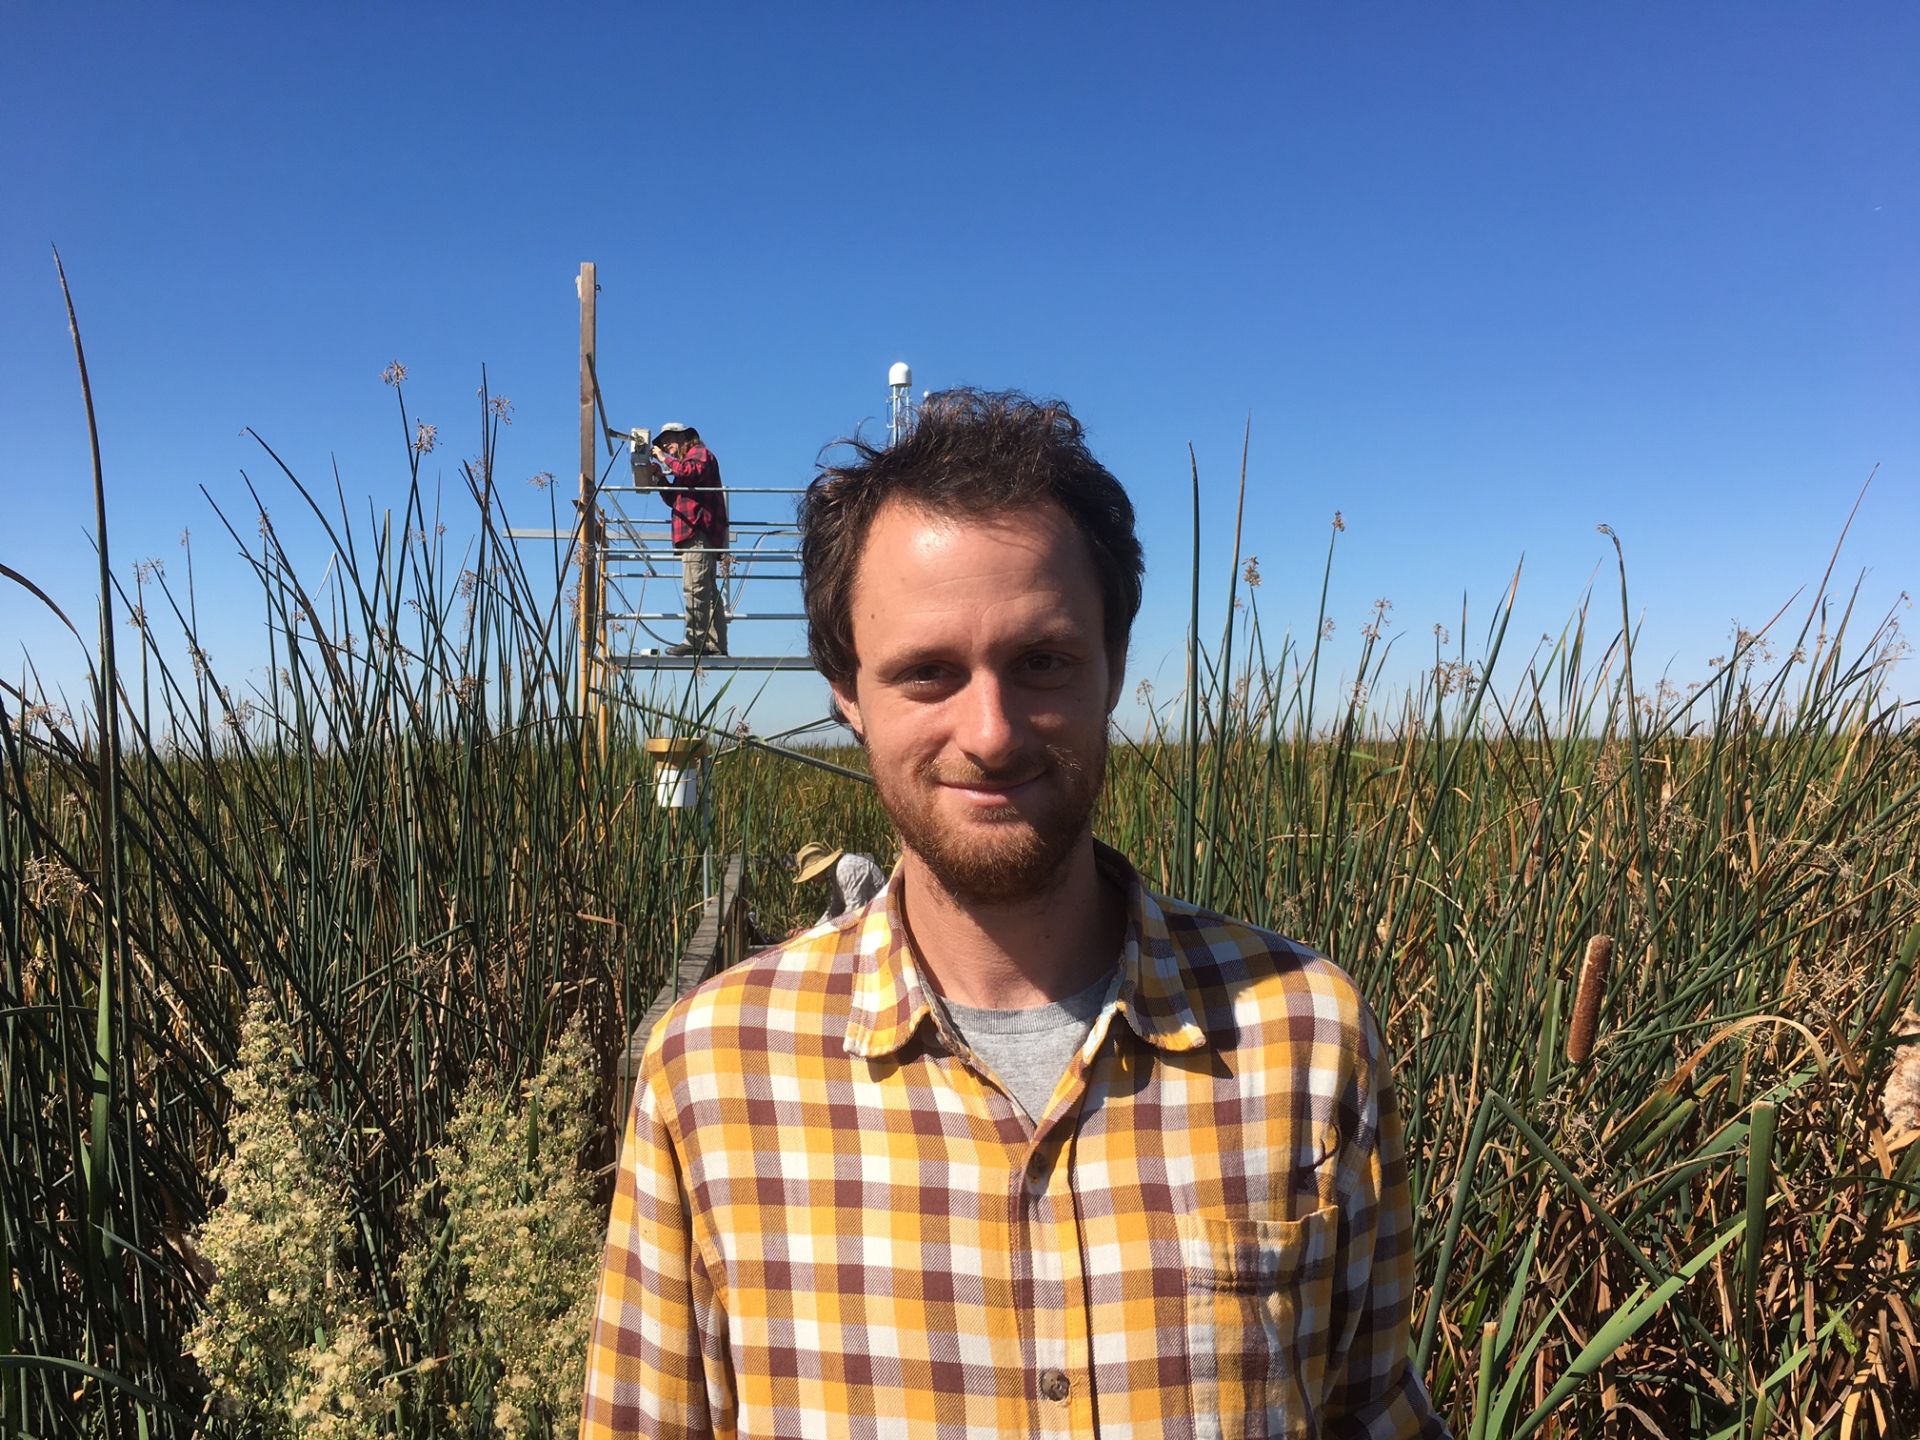
20160929EE_Sam.jpg ( 2016-09-29 11:41:50 ) Full size: 1920x1440
Sam at East End
11 sets found
14 EE_met graphs found
Can't check EE_mixed
1 EE_mixed graphs found
8 EE_flux graphs found
Can't check MBWPEESWGT_mixed
1 EE_cam graphs found
Can't check MBEEWPSWEPGT_cam
Can't check SIMBTWEE_met
Can't check EE_Temp
5 EE_Temp graphs found
Can't check EE_minidot
1 EE_minidot graphs found
Can't check MBSWEEWPBCBA
1 EE_processed graphs found