Field Notes
<--2016-09-22 16:15:00 | 2016-10-11 14:05:00-->Other sites visited today: Sherman Wetland | Mayberry | East End | Twitchell Rice | West Pond
Phenocam link: Searching...
Twitchell Alfalfa: 2016-09-29 14:00:00 (DOY 273)
Author: Joe Verfaillie
Others: Dennis, Kyle, Sam
Summary: Bales on the field, irrigation ditch full or water, grading around tower and ditch.
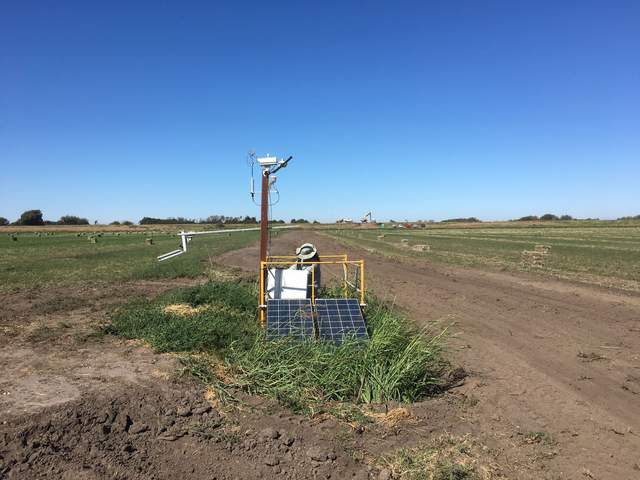
| Twitchell Alfalfa 2016-09-29 I arrived about 2pm with Dennis, Kyle and Sam. The field was full of bales and we saw a baler working on it when we arrive on Twitchell earlier in the day. The ditch to the south of the field was full of water. They have scrapped the edge of the field next to the tower and filled the ditch with dirt. The tower is now in a little depression. I wanted to move the tower up near the soil and radiation measurements but it was late and we would have to dig up the power line. The 7500 read: 388.4ppm CO2, 434.8mmol/m3 H2O, 24.99C, 101.8kPa, 80.19SS I think the 7500 was dirty from the grading work around the tower. After cleaning the SS was 86.3, CO2 was 408.4ppm and H2O was 488.0mmol/m3 We finished clipping the alfalfa near the ground sensors and Kyle tried to clean up some of the litter under the radiation sensors. Dennis clipped the weeds around the tower. Neither camera seemed to collect very many images. Dennis did spectral reflectance. Kyle did soil respiration. I collected the data from the FD chamber. It is very slow collecting and deleting the data. Also the reset of power afterwards is flakey. |
2 photos found

20160929TA_GradingNearTower.jpg ( 2016-09-29 14:29:28 ) Full size: 1920x1440
They have scrapped the edge of the field next to the tower and filled the ditch with dirt, so the tower is now sitting in a little depression

20160929TA_FieldPano.jpg ( 2016-09-29 14:28:21 ) Full size: 1920x523
Panoramic shot of alfalfa field
7 sets found
Can't check TA_met
11 TA_met graphs found
Can't check TA_rad
3 TA_rad graphs found
Can't check TA_flux
5 TA_flux graphs found
Can't check TA_soilco2
7 TA_soilco2 graphs found
No data found for TA_arable.
1 TA_cam graphs found
Can't check TATWBABCSB_cam

