Field Notes
<--2016-06-24 09:00:00 | 2016-07-15 13:30:00-->Other sites visited today: Mayberry | Twitchell Rice | East End | West Pond | Twitchell Alfalfa
Phenocam link: Searching...
Sherman Wetland: 2016-07-06 09:10:00 (DOY 188)
Author: Alison Haddad
Others: Elke Eichelmann, Kyle Hemes
Summary: Measured sonic boom angle and veg height, took well measurements, normal data collection.
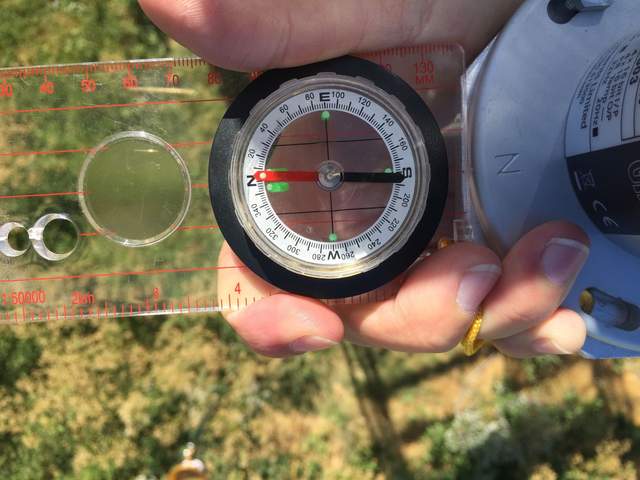
| Arrived at 9:10. Warm, sunny, windy, clear sky with fog on the horizon. Field was very dry and the dry riverbed was covered in mineral deposits. Well was completely dry. Some of Bruce's people were out there when we arrived and had started to build the boardwalk to our tower from the berm. They intended to build the boardwalk from the berm to the solar panels and then a second one from there to the tower. Methane wash water reservoir filled, was nearly full. Collected USB GHG data, collected met data from CR1000, collected camera data. Removed CF card “TA†and replaced with new CF card. Cleaned solar panels. Measured sonic boom angle: 355 degrees from magnetic north, 9 degrees from true north. Took well measurements: Well depth: 147.5 cm Well height above ground: 46 cm Top of well to water pressure sensor: 131 cm Took vegetation (mainly pepperweed) height in cm: 84, 89, 99, 95, 90, 85, 87, 102, 114, 93. LI7500 readings CO2 381.13 H2O 658.4 T 21.06 P 101.45 ss 98.91 LI7700 readings CH4 1.94 rssi 55.7->84 after cleaning left: 10:00 |
3 photos found

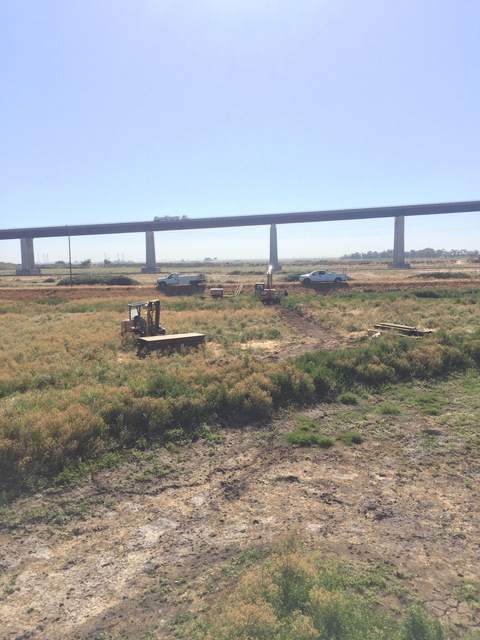
20160706SW_BoardwalkConst2_tn.jpg ( 2016-07-06 09:20:23 ) Full size: 1440x1920
Bruce's crew on site starting boardwalk construction

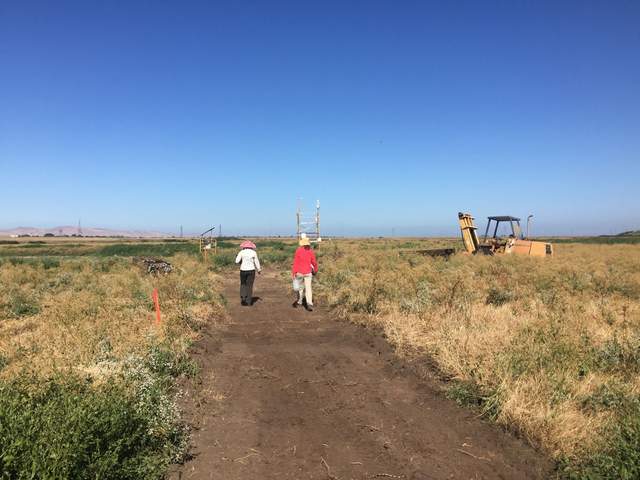
20160706SW_BoardwalkConst1_tn.jpg ( 2016-07-06 09:16:07 ) Full size: 1920x1440
Elke and Alison on site

20160706SW_SonicHeading_tn.jpg ( 2016-07-06 09:39:24 ) Full size: 1920x1440
Sonic heading is 9 degrees from true north
7 sets found
Can't check MBWPEESWGT_mixed
Can't check MBEEWPSWEPGT_cam
15 SW_met graphs found
4 SW_flux graphs found
Can't check MBSWEEWPBCBA
Can't check SW_Temp
14 SW_Temp graphs found
No data found for SW_arable.

