Field Notes
<--2016-05-17 09:15:00 | 2016-06-06 14:50:00-->Other sites visited today: Sherman Wetland | Twitchell Rice | East End | West Pond | Mayberry
Phenocam link: Searching...
Twitchell Alfalfa: 2016-05-24 13:50:00 (DOY 145)
Author: Alison Haddad
Others: Elke Eichelmann
Summary: regular data collection; did spectral, soil respiration, and clip plots.
| Arrived at 13:50. Sunny, mostly clear, fluffy clouds on horizon, light wind. Alfalfa about 55cm tall and flowering. Collected USB data, collected met data from CR1000, collected camera pictures, collected soil CO2 data, collected radiation CR10X data. Cleaned solar panels. Did spectral measurements. Light and dark reference every 5 samples. Halfway through, the references and samples took longer to process. This might be due to thin high clouds developing while the data was collected. The spectral data from today should be used carefully. Did soil respiration measurements. Took canopy height measurements in cm: 60; 47; 45; 60; 53; 56; 47; 62; 59; 54; 42; 55; 63; 59; 60; 67; 50; 55; 62; 58. Did five clip plots. Sample No; canopy height (cm); fresh weight (g); LAI (cm2) 1; 65; 206.50; 3513.95 2; 47; 133.28; 2646.35 3; 50; 147.52; 2713.62 4; 58; 189.90; 3892.14 5; 55; 178.12; 3086.46 LI7500 readings CO2 378.03 H2O 715.3 T 21.67 P 101.59 SS 93.04 ->97.8 after cleaning Left at 15:21 |
Veg Height (cm): Tape measure from ground to top of plant - Flowering
60, 48, 46, 60, 53, 56, 47, 62, 60, 55, 43, 56, 63, 59, 60, 67, 51, 55, 63, 59, avg = 56.2, stdev = 6.43
1 photos found

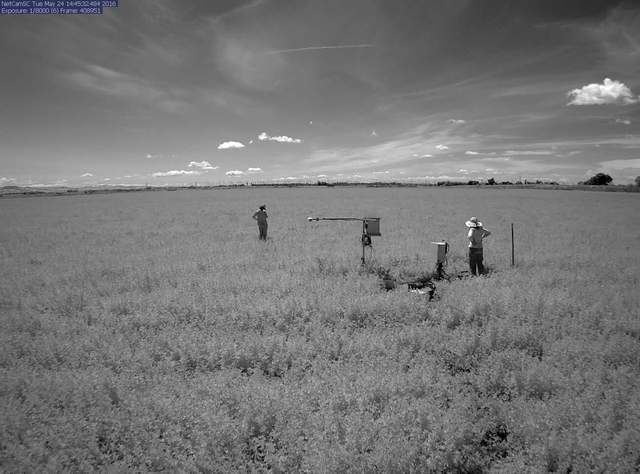
twitchellalfalfa_IR_2016_05_24_144532.jpg ( 2016-05-24 00:00:00 ) Full size: 1296x960
Alison and Elke on site in IR
7 sets found
Can't check TA_met
11 TA_met graphs found
Can't check TA_rad
3 TA_rad graphs found
Can't check TA_flux
5 TA_flux graphs found
Can't check TA_soilco2
7 TA_soilco2 graphs found
No data found for TA_arable.
1 TA_cam graphs found
Can't check TATWBABCSB_cam

