
Field Notes
<--2015-12-02 09:30:00 | 2016-01-20 13:00:00-->Other sites visited today: Tonzi | Twitchell Rice | Tonzi
Phenocam link: Searching...
Vaira: 2015-12-23 09:30:00 (DOY 357)
Author: Joe Verfaillie
Others: Siyan
Summary: Reinstalled Peltier SHF plate, water in battery box, fixed RPi screen resolution, adjusted stardot clock
| Varia 2015-12-23 I arrived about 9:30 with Siyan. It was clear, sunny and cool with a light breeze. There have been a couple days of rain. There are puddles on the road and the water hole is about half full, but the ground is not sloppy wet. I think the ground soaked up most of the rain. The trees have lost their leaves or all turned to brown. The grass is green but not growing very fast. A bunch of cows rushed over to wish us merry Christmas when we arrived. I reinstalled the top Peltier SHF plate sn P01. I soldered it on to the existing cable and buried it at -2cm. I nearly cut the wire on SHF plate 0143 looking for some extra dirt. The lid of the west battery box blew off and there was about 3 inches of water in that box and a dead mouse and mouse nest. I couldn’t figure out how to dump the water out without disconnecting all the batteries. I ended up digging out around the low corner and poking a hole in the box. This seemed to do the trick. We put the ladder on top of the boxes when we left. Siyan collected the data and did spectral measurements. I fixed the screen resolution on the Raspberry Pi. The screen was reporting a resolution of 1280x1024 at 60Hz, I set it to 1024x768 at 60Hz. Looks like all the images were collected. The StarDot clock was about 12min fast. I reset it at from 10:10 to 9:58. The Raspberry Pi is still on UTC. |
Field Data
No tank data
Well Depth
| Date | Location | Depth (feet) |
|---|---|---|
| 2015-12-23 | TZ_floor | 32.1 |
| 2015-12-23 | TZ_road | 40 |
| 2015-12-23 | TZ_tower | 36.8 |
mode = both
Moisture Point Probes TZ
Array
(
[0] => Tower_1
[1] => Floor_South_1
[2] => Floor_East_1
[3] => Floor_West_1
[4] => SoilCO2_1
[5] => Soil_Transect_4_1
[6] => Soil_Transect_3_1
[7] => Soil_Transect_2_1
[8] => Soil_Transect_1_1
[9] => SoilCO2_West_A_1
[10] => SoilCO2_West_B_1
[11] => SoilCO2_West_C_1
[12] => Tower_2
[13] => Floor_South_2
[14] => Floor_East_2
[15] => Floor_West_2
[16] => SoilCO2_2
[17] => Soil_Transect_4_2
[18] => Soil_Transect_3_2
[19] => Soil_Transect_2_2
[20] => Soil_Transect_1_2
[21] => SoilCO2_West_A_2
[22] => SoilCO2_West_B_2
[23] => SoilCO2_West_C_2
[24] => Tower_3
[25] => Floor_South_3
[26] => Floor_East_3
[27] => Floor_West_3
[28] => SoilCO2_3
[29] => Soil_Transect_4_3
[30] => Soil_Transect_3_3
[31] => Soil_Transect_2_3
[32] => Soil_Transect_1_3
[33] => SoilCO2_West_A_3
[34] => SoilCO2_West_B_3
[35] => SoilCO2_West_C_3
[36] => Tower_4
[37] => Floor_East_4
[38] => Floor_West_4
[39] => SoilCO2_4
[40] => Soil_Transect_4_4
[41] => Soil_Transect_3_4
[42] => Soil_Transect_2_4
[43] => Soil_Transect_1_4
[44] => SoilCO2_West_A_4
[45] => SoilCO2_West_B_4
[46] => SoilCO2_West_C_4
)
| Date | DOY | Rep | Depth | Tower_1 |
Floor_South_1 |
Floor_East_1 |
Floor_West_1 |
SoilCO2_1 |
Soil_Transect_4_1 |
Soil_Transect_3_1 |
Soil_Transect_2_1 |
Soil_Transect_1_1 |
SoilCO2_West_A_1 |
SoilCO2_West_B_1 |
SoilCO2_West_C_1 |
Tower_2 |
Floor_South_2 |
Floor_East_2 |
Floor_West_2 |
SoilCO2_2 |
Soil_Transect_4_2 |
Soil_Transect_3_2 |
Soil_Transect_2_2 |
Soil_Transect_1_2 |
SoilCO2_West_A_2 |
SoilCO2_West_B_2 |
SoilCO2_West_C_2 |
Tower_3 |
Floor_South_3 |
Floor_East_3 |
Floor_West_3 |
SoilCO2_3 |
Soil_Transect_4_3 |
Soil_Transect_3_3 |
Soil_Transect_2_3 |
Soil_Transect_1_3 |
SoilCO2_West_A_3 |
SoilCO2_West_B_3 |
SoilCO2_West_C_3 |
Tower_4 |
Floor_East_4 |
Floor_West_4 |
SoilCO2_4 |
Soil_Transect_4_4 |
Soil_Transect_3_4 |
Soil_Transect_2_4 |
Soil_Transect_1_4 |
SoilCO2_West_A_4 |
SoilCO2_West_B_4 |
SoilCO2_West_C_4 |
Avg | Spacial Count |
Measurement Count |
|---|---|---|---|---|---|---|---|---|---|---|---|---|---|---|---|---|---|---|---|---|---|---|---|---|---|---|---|---|---|---|---|---|---|---|---|---|---|---|---|---|---|---|---|---|---|---|---|---|---|---|---|---|---|
| 2015-12-23 | 357 | 0 | nan | 23.8 | 21.4 | 30.8 | 27.3 | 29.9 | 22.3 | 20.3 | 22 | 22.3 | 21.7 | 22.9 | 22.6 | 30.1 | 32.3 | 49.4 | 27.1 | 31.3 | 23.7 | 31 | 30.4 | 17.3 | 38.1 | 16.7 | 29.8 | 16.5 | 35.4 | 51.1 | 29.3 | 39.4 | 24.3 | 31.3 | 30.1 | 20.1 | 42.4 | 35.2 | 36.6 | 10.7 | 75.2 | 74.9 | 38.2 | 27.5 | 42.8 | 19.9 | 10.7 | 41.4 | 47.1 | 46.3 | |||
| 2015-12-23 | 357 | 1 | nan | 23.8 | 21.2 | 31.1 | 27.3 | 30.5 | 22.9 | 19.7 | 22.6 | 22.3 | 22 | 22.3 | 22 | 31 | 32.3 | 40.5 | 26.7 | 30.1 | 23.7 | 31.6 | 30.4 | 17.3 | 31 | 17 | 30.1 | 17.9 | 34.9 | 50.5 | 28.5 | 39.4 | 24.3 | 32.1 | 30.7 | 21.5 | 42.4 | 35.4 | 36.3 | 10.2 | 74.8 | 86.1 | 36.2 | 31.4 | 43.1 | 20.5 | 9.9 | 41.1 | 48 | 47.7 | |||
| 2015-12-23 | 357 | Avg | 0-15cm | 0 | 0 | ||||||||||||||||||||||||||||||||||||||||||||||||
| 2015-12-23 | 357 | Avg | 15-30cm | 0 | 0 | ||||||||||||||||||||||||||||||||||||||||||||||||
| 2015-12-23 | 357 | Avg | 30-45cm | 0 | 0 | ||||||||||||||||||||||||||||||||||||||||||||||||
| 2015-12-23 | 357 | Avg | 45-60cm | 0 | 0 |
mode = both
Moisture Point Probes VR
Array
(
[0] => Solar_Panels_1
[1] => Flux_Tower_1
[2] => Gate_1
[3] => Biomass_Cage_1
[4] => Solar_Panels_2
[5] => Flux_Tower_2
[6] => Gate_2
[7] => Biomass_Cage_2
[8] => Solar_Panels_3
[9] => Flux_Tower_3
[10] => Gate_3
[11] => Biomass_Cage_3
[12] => Solar_Panels_4
[13] => Flux_Tower_4
[14] => Gate_4
[15] => Biomass_Cage_4
)
| Date | DOY | Rep | Depth | Solar_Panels_1 |
Flux_Tower_1 |
Gate_1 |
Biomass_Cage_1 |
Solar_Panels_2 |
Flux_Tower_2 |
Gate_2 |
Biomass_Cage_2 |
Solar_Panels_3 |
Flux_Tower_3 |
Gate_3 |
Biomass_Cage_3 |
Solar_Panels_4 |
Flux_Tower_4 |
Gate_4 |
Biomass_Cage_4 |
Avg | Spacial Count |
Measurement Count |
|---|---|---|---|---|---|---|---|---|---|---|---|---|---|---|---|---|---|---|---|---|---|---|
| 2015-12-23 | 357 | 0 | nan | 25 | 13.2 | 20 | 10.9 | 29.5 | 28.9 | 22.2 | 24.6 | 32.7 | 16.8 | 32.4 | 31.8 | 42.3 | 30.8 | 38.8 | 33.7 | |||
| 2015-12-23 | 357 | 1 | nan | 20.9 | 22.9 | 19.4 | 10.3 | 29.2 | 29.2 | 22.2 | 24.9 | 32.9 | 17.3 | 32.7 | 31.8 | 42.3 | 31.4 | 38.2 | 32.8 | |||
| 2015-12-23 | 357 | Avg | 0-15cm | 0 | 0 | |||||||||||||||||
| 2015-12-23 | 357 | Avg | 15-30cm | 0 | 0 | |||||||||||||||||
| 2015-12-23 | 357 | Avg | 30-45cm | 0 | 0 | |||||||||||||||||
| 2015-12-23 | 357 | Avg | 45-60cm | 0 | 0 |
No TZ grass heigth found
No VR grass heigth found
No VR Tree DBH found
No water potential data found
No VR Grass Biomass data found
No VR OakLeaves Biomass data found
No VR PineNeedles Biomass data found
2 photos found
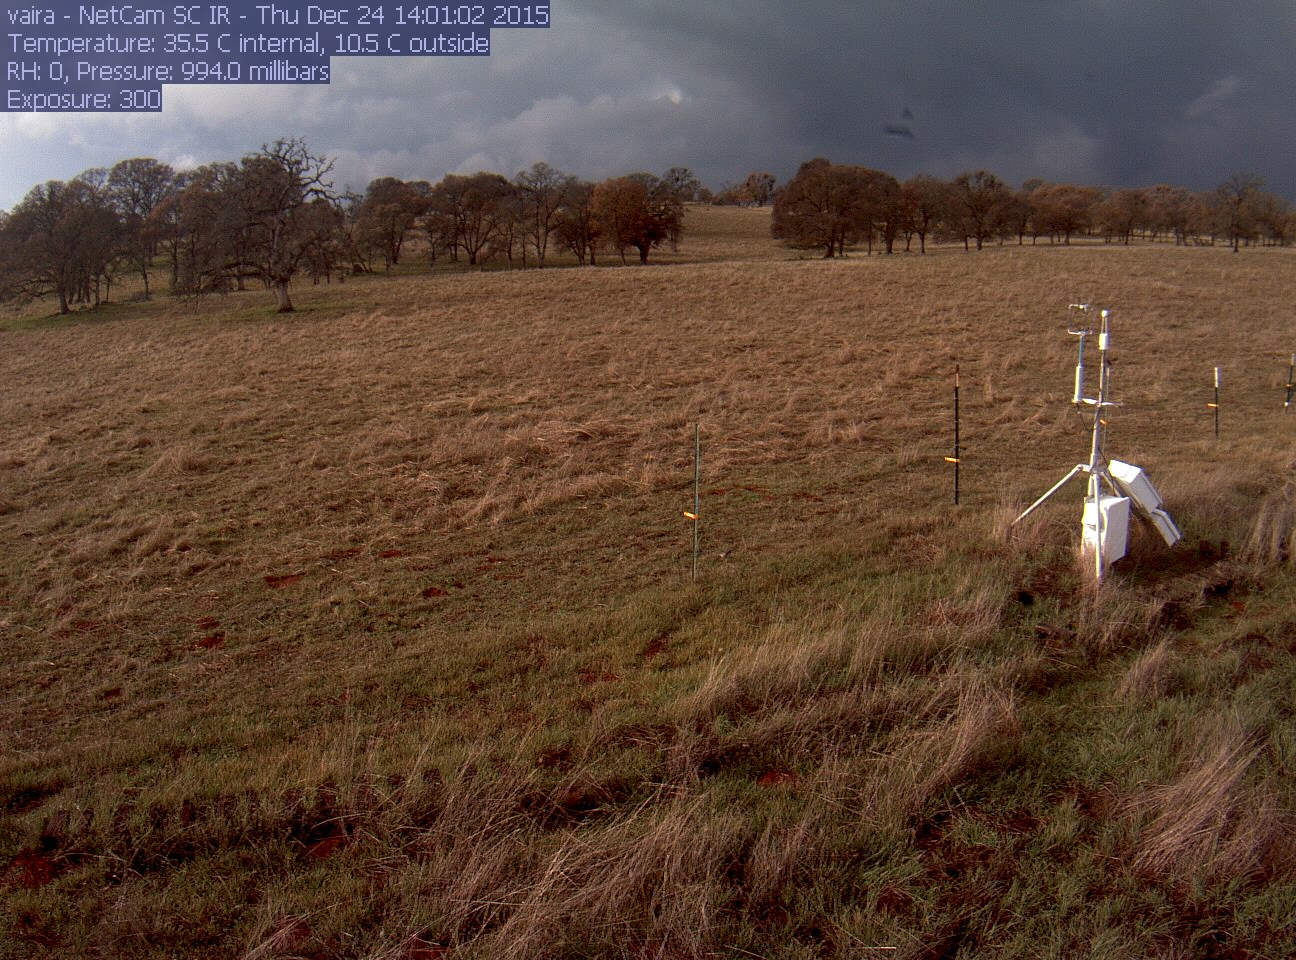
vaira_2015_12_24_140102.jpg ( 2015-12-24 20:26:22 ) Full size: 1296x960
Rain coming
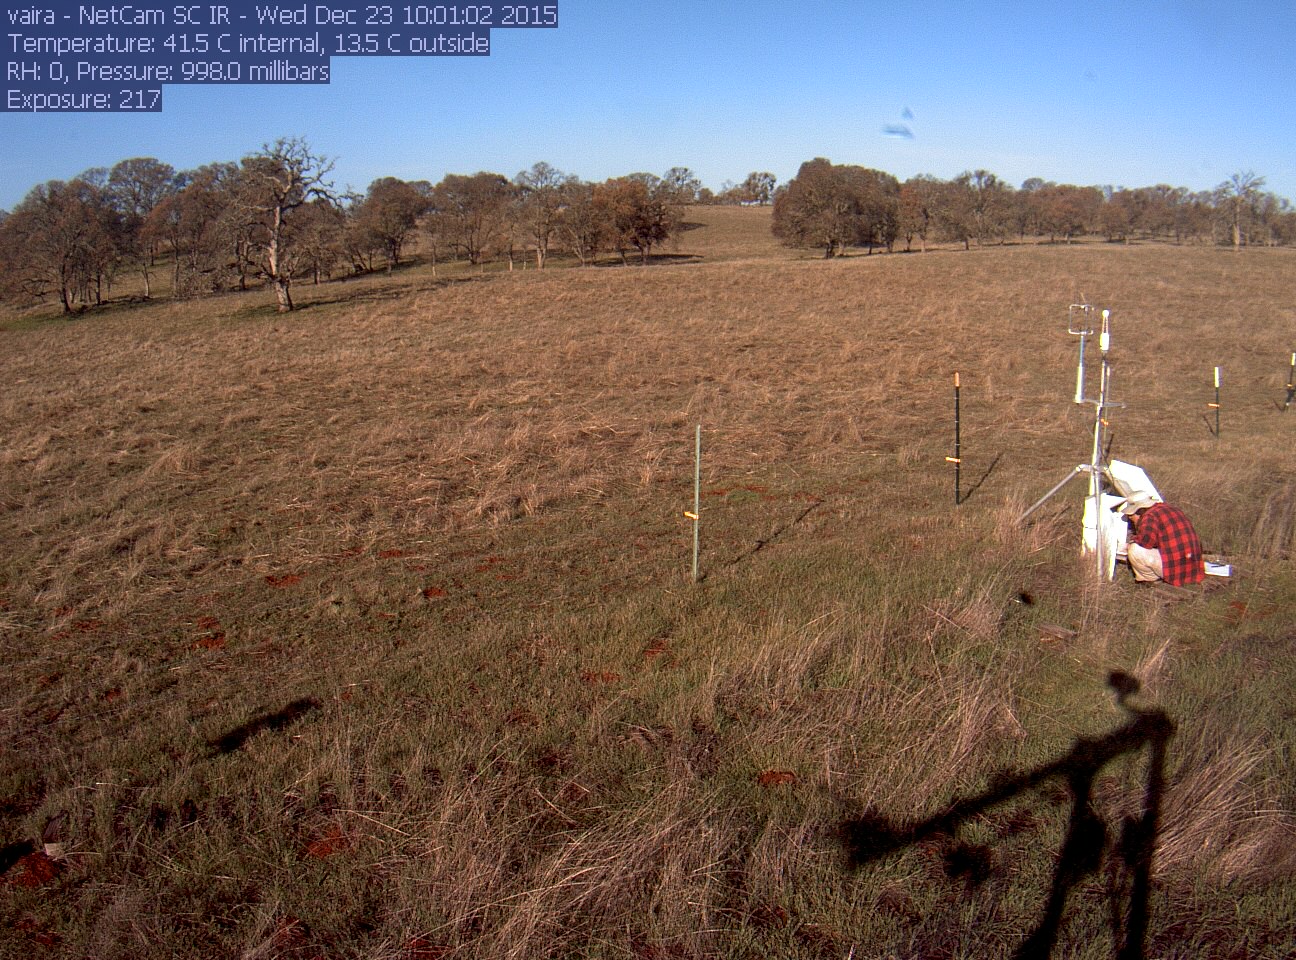
vaira_2015_12_23_100102.jpg ( 2015-12-23 16:26:22 ) Full size: 1296x960
Joe on site
9 sets found
16 VR_met graphs found
2 VR_flux graphs found
6 VR_soilco2 graphs found
No data found for VR_pond.
Can't check TZVR_mixed
No data found for VR_fd.
No data found for VR_processed.
No data found for VR_arable.
No data found for VR_soilvue.