Field Notes

<--2015-04-09 11:50:00 | 2015-05-07 15:05:00-->
Other sites visited today: Sherman Island | Mayberry | Twitchell Rice | West Pond | Twitchell Alfalfa
Phenocam link: Searching...

East End: 2015-04-23 11:45:00 (DOY 113)
Author: Joe Verfaillie
Others: Patty

Summary: Swapped 7500, installed Canon camera, very green a tall cattails.

East End
2015-04-23

I arrived about 11:45. It was a mild, sunny day with a cool breeze from the west. The site is very green and the cattails are already about 2m tall and threatening to shade the solar panels. I’ll have to figure out a way to raise them.

The 7700 read: 2.02ppm CH4, 44.49RSSI – 88.21 after cleaning - reservoir was full

Patty swapped the 7500, sn 1594 went on, sn 0418 came off
After swap the 7500 read: 16.85mmol/m3 CO2, 518.5mmol/m3 H2O, 20.85C, 101.01kPa

I installed a new Canon PowerShot A2600. The Raspberry Pi was working and left in place for an inter-comparison with the Canon.

I forgot the block to plug the openings in the boom to prevent wasp infestations.

2 photos found

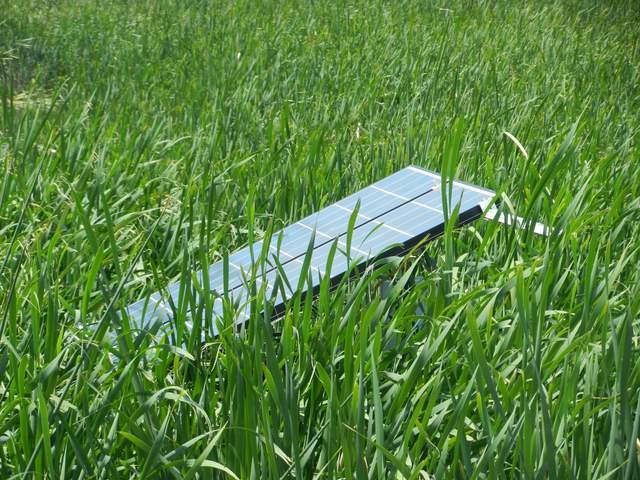
2+ meter cattails are starting to shade the solar panels
20154023EE_SolarPanels.jpg ( 2015-04-23 12:29:20 ) Full size: 1920x1440
2+ meter cattails are starting to shade the solar panels
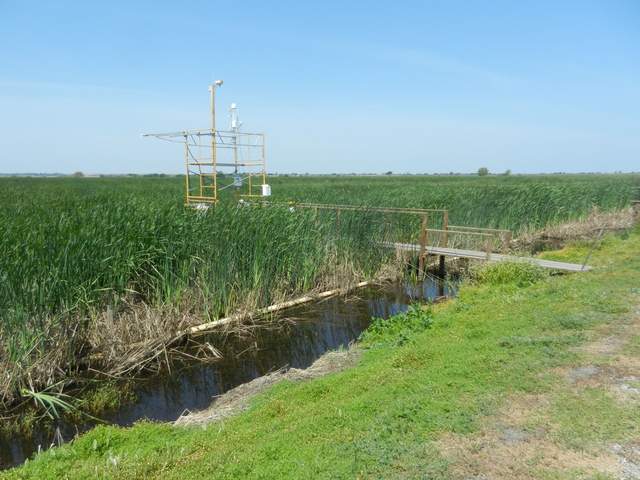
Cattails are super green around the tower
20150423EE_Tower.jpg ( 2015-04-23 12:28:51 ) Full size: 1920x1440
Cattails are super green around the tower

Graphs display:
11 sets found

14 EE_met graphs found

Explore the graph:Temperature and Batt V in a new window

Explore the graph:Soil Moisture and Well Pressure in a new window

Explore the graph:Solar Radiation in a new window

Explore the graph:PAR in a new window

Explore the graph:Soil Heat Flux in a new window

Explore the graph:Water Level and Rain in a new window

Explore the graph:Soil/Water Temperature Set 1 in a new window

Explore the graph:Soil/Water Temperature Set 2 in a new window

Explore the graph:Soil/Water Temperature Set 3 in a new window

Explore the graph:Dissolved Oxygen and Wind Speed in a new window

Explore the graph:SRS NDVI Channels in a new window

Explore the graph:Apogee NDVI in a new window

Explore the graph:NDVI in a new window

Explore the graph:Undercanopy PAR in a new window

Can't check EE_mixed
1 EE_mixed graphs found

Explore the graph:Air Pressure and RH in a new window

8 EE_flux graphs found

Explore the graph:Wind Speeds in a new window

Explore the graph:LI7500 CO2 and H2O in a new window

Explore the graph:LI7700 CH4 and RSSI in a new window

Explore the graph:Flux Counts in a new window

Explore the graph:Instument Temperatures in a new window

Explore the graph:Temp Tower 3 (Mixed Veg) in a new window

Explore the graph:Temp Tower 3 (Mixed Veg) in a new window

Explore the graph:Temp Tower 3 (Mixed Veg) in a new window

Can't check MBWPEESWGT_mixed
1 EE_cam graphs found

Explore the graph:EE Autocam GCC in a new window

Can't check MBEEWPSWEPGT_cam
Can't check SIMBTWEE_met
Can't check EE_Temp
5 EE_Temp graphs found

Explore the graph:Sonic SOS in a new window

Explore the graph:LI7500 CO2 in a new window

Explore the graph:Water Level in a new window

Explore the graph:LI-7700 CH4 in a new window

Explore the graph:Wind Speed in a new window

Can't check EE_minidot
1 EE_minidot graphs found

Explore the graph:EE miniDOT Dissolved Oxygen in a new window

Can't check MBSWEEWPBCBA
1 EE_processed graphs found

Explore the graph:CO2 Fluxes in a new window