Field Notes
<--2014-06-17 09:30:00 | 2014-06-26 09:10:00-->Other sites visited today: Sherman Island | Mayberry | Twitchell Rice | East End | West Pond | Twitchell Alfalfa
Phenocam link: Searching...
Sherman Island: 2014-06-26 00:00:00 (DOY 177)
Author: Joe Verfaillie
Others: Patty, Madeleine, Picarro, Silver lab
Summary: Installed the Picarro / Forerunner automated chamber system.
| Sherman 2014-06-26 We installed a forerunner autochamber (AC001) with Picarro G2508 analyzer which uses cavity ring-down laser absorption spectroscopy to measure concentrations of CO2, H2O, CH4, N2O and NH3 on June 25 2014. This was installed by Caleb Arata and Karrin Alstad from Picarro and in collaboration with Nabil Saad from Picarro, Nick Nickerson, Gordon McArthur and Chance from Forerunner. We also collaborated with Whendee Silver’s lab including Heater and Leilei who installed three static chambers near the forerunner autochamber. The Picarro analyzer went in to the plastic box enclosure along with a pump and CR10X sn 35475 to control the box fans. The auto chamber went just west of the existing soil respiration equipment. The static chambers from Whendee’s lab went to the north of the auto chamber. Static chamber measurements were collected for eight consecutive days at Sherman by either Leilei Ruan, Ryan Salladay, and/or Heather Dang (June 26-July2). The auto-chamber system will be moved to Alfalfa for a day long campaign and then to Whendee’s site in Marin for another week or so. |
Veg Height (cm): Tape measure from ground to top of plant - pepperweed mostly dried out.Grass dry.
80, 85, 20, 10, 50, 75, 82, 8, 88, 55, 81, 78, 72, 54, 6, 45, 50, 75, 44, 80, avg = 56.9, stdev = 27.46
1 photos found

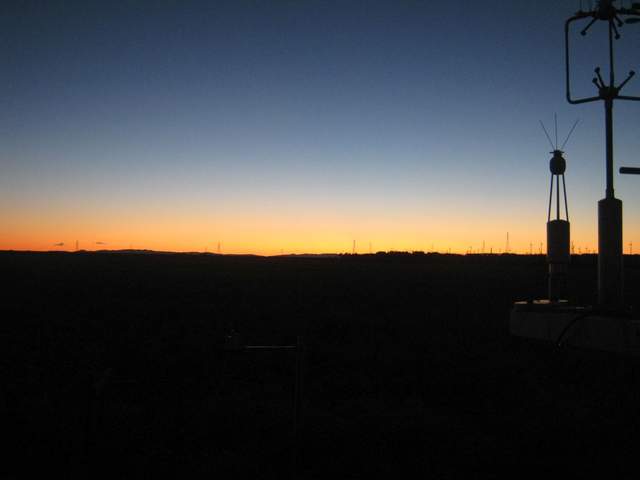
SI_autocam_20140627_2015.jpg ( 2014-06-27 20:15:02 ) Full size: 1920x1440
Nice sunset
7 sets found
No data found for SI_mp.
11 SI_met graphs found
Can't check SI_mixed
2 SI_mixed graphs found
4 SI_flx graphs found
4 SI_soilco2 graphs found
Can't check TWSI_mixed
Can't check SIMBTWEE_met

