
Field Notes
<--2010-08-05 13:30:00 | 2010-08-11 09:30:00-->Other sites visited today: Sherman Island | Twitchell Rice | Twitchell Rice
Phenocam link: Searching...
Sherman Island: 2010-08-11 09:15:00 (DOY 223)
Author: Jaclyn Hatala
Others: Joe
| Sherman: Arrived around 9:15am, cool temperatures with a strong breeze from the W/SW. Cows were in the far northwest corner of the field, but there was plenty of "fresh evidence" that they had recently been closer to the tower. It seems like a lot of the plants are doing quite well. The field is more a patchwork of different types of plants at this point, with pepperweed, grasses, a bunch of unidentified herbaceous species, and even some patches of clover. Mean LAI was 4.5. I took spectral reflectance measurements, 5 biomass clip plots, and measured LAI along the 200m transect with the LAI-2200. Water table was 57cm in the enclosure, 52cm in the south well, and the north well is still dry.
|
8 photos found
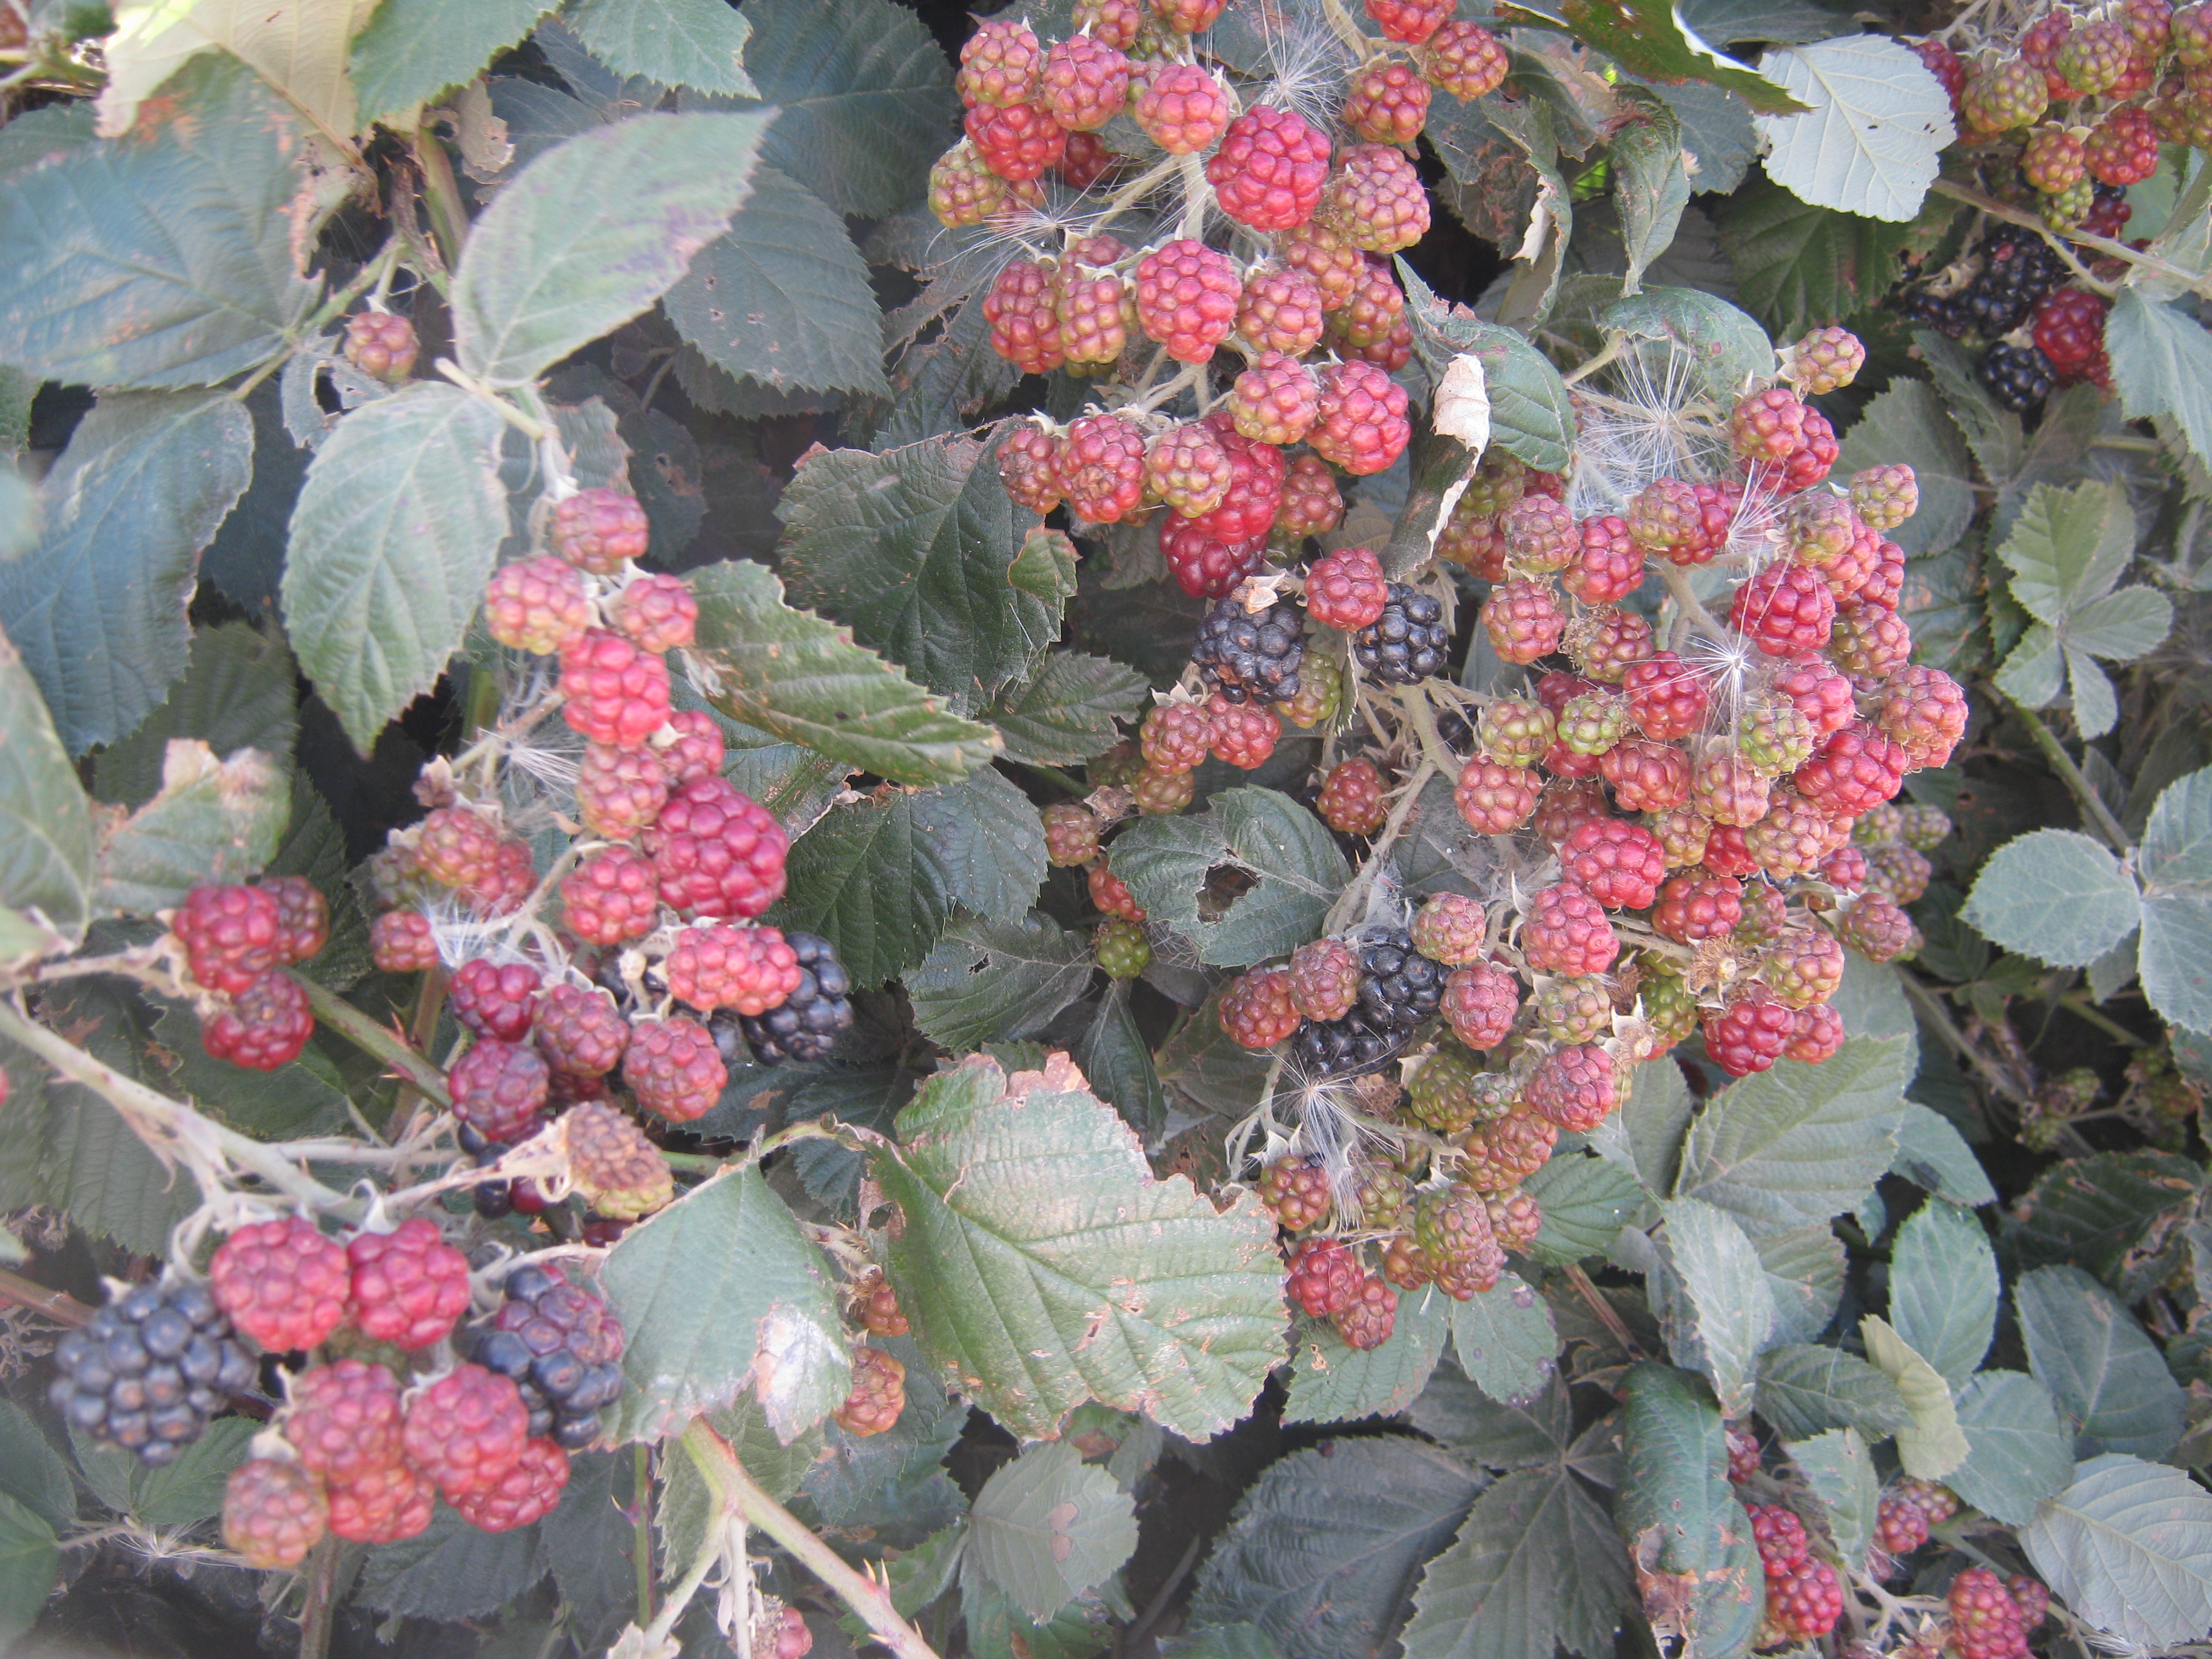
20100811SI_Blackberries.jpg ( 2010-08-11 10:51:40 ) Full size: 3648x2736
Bunches of blackberries
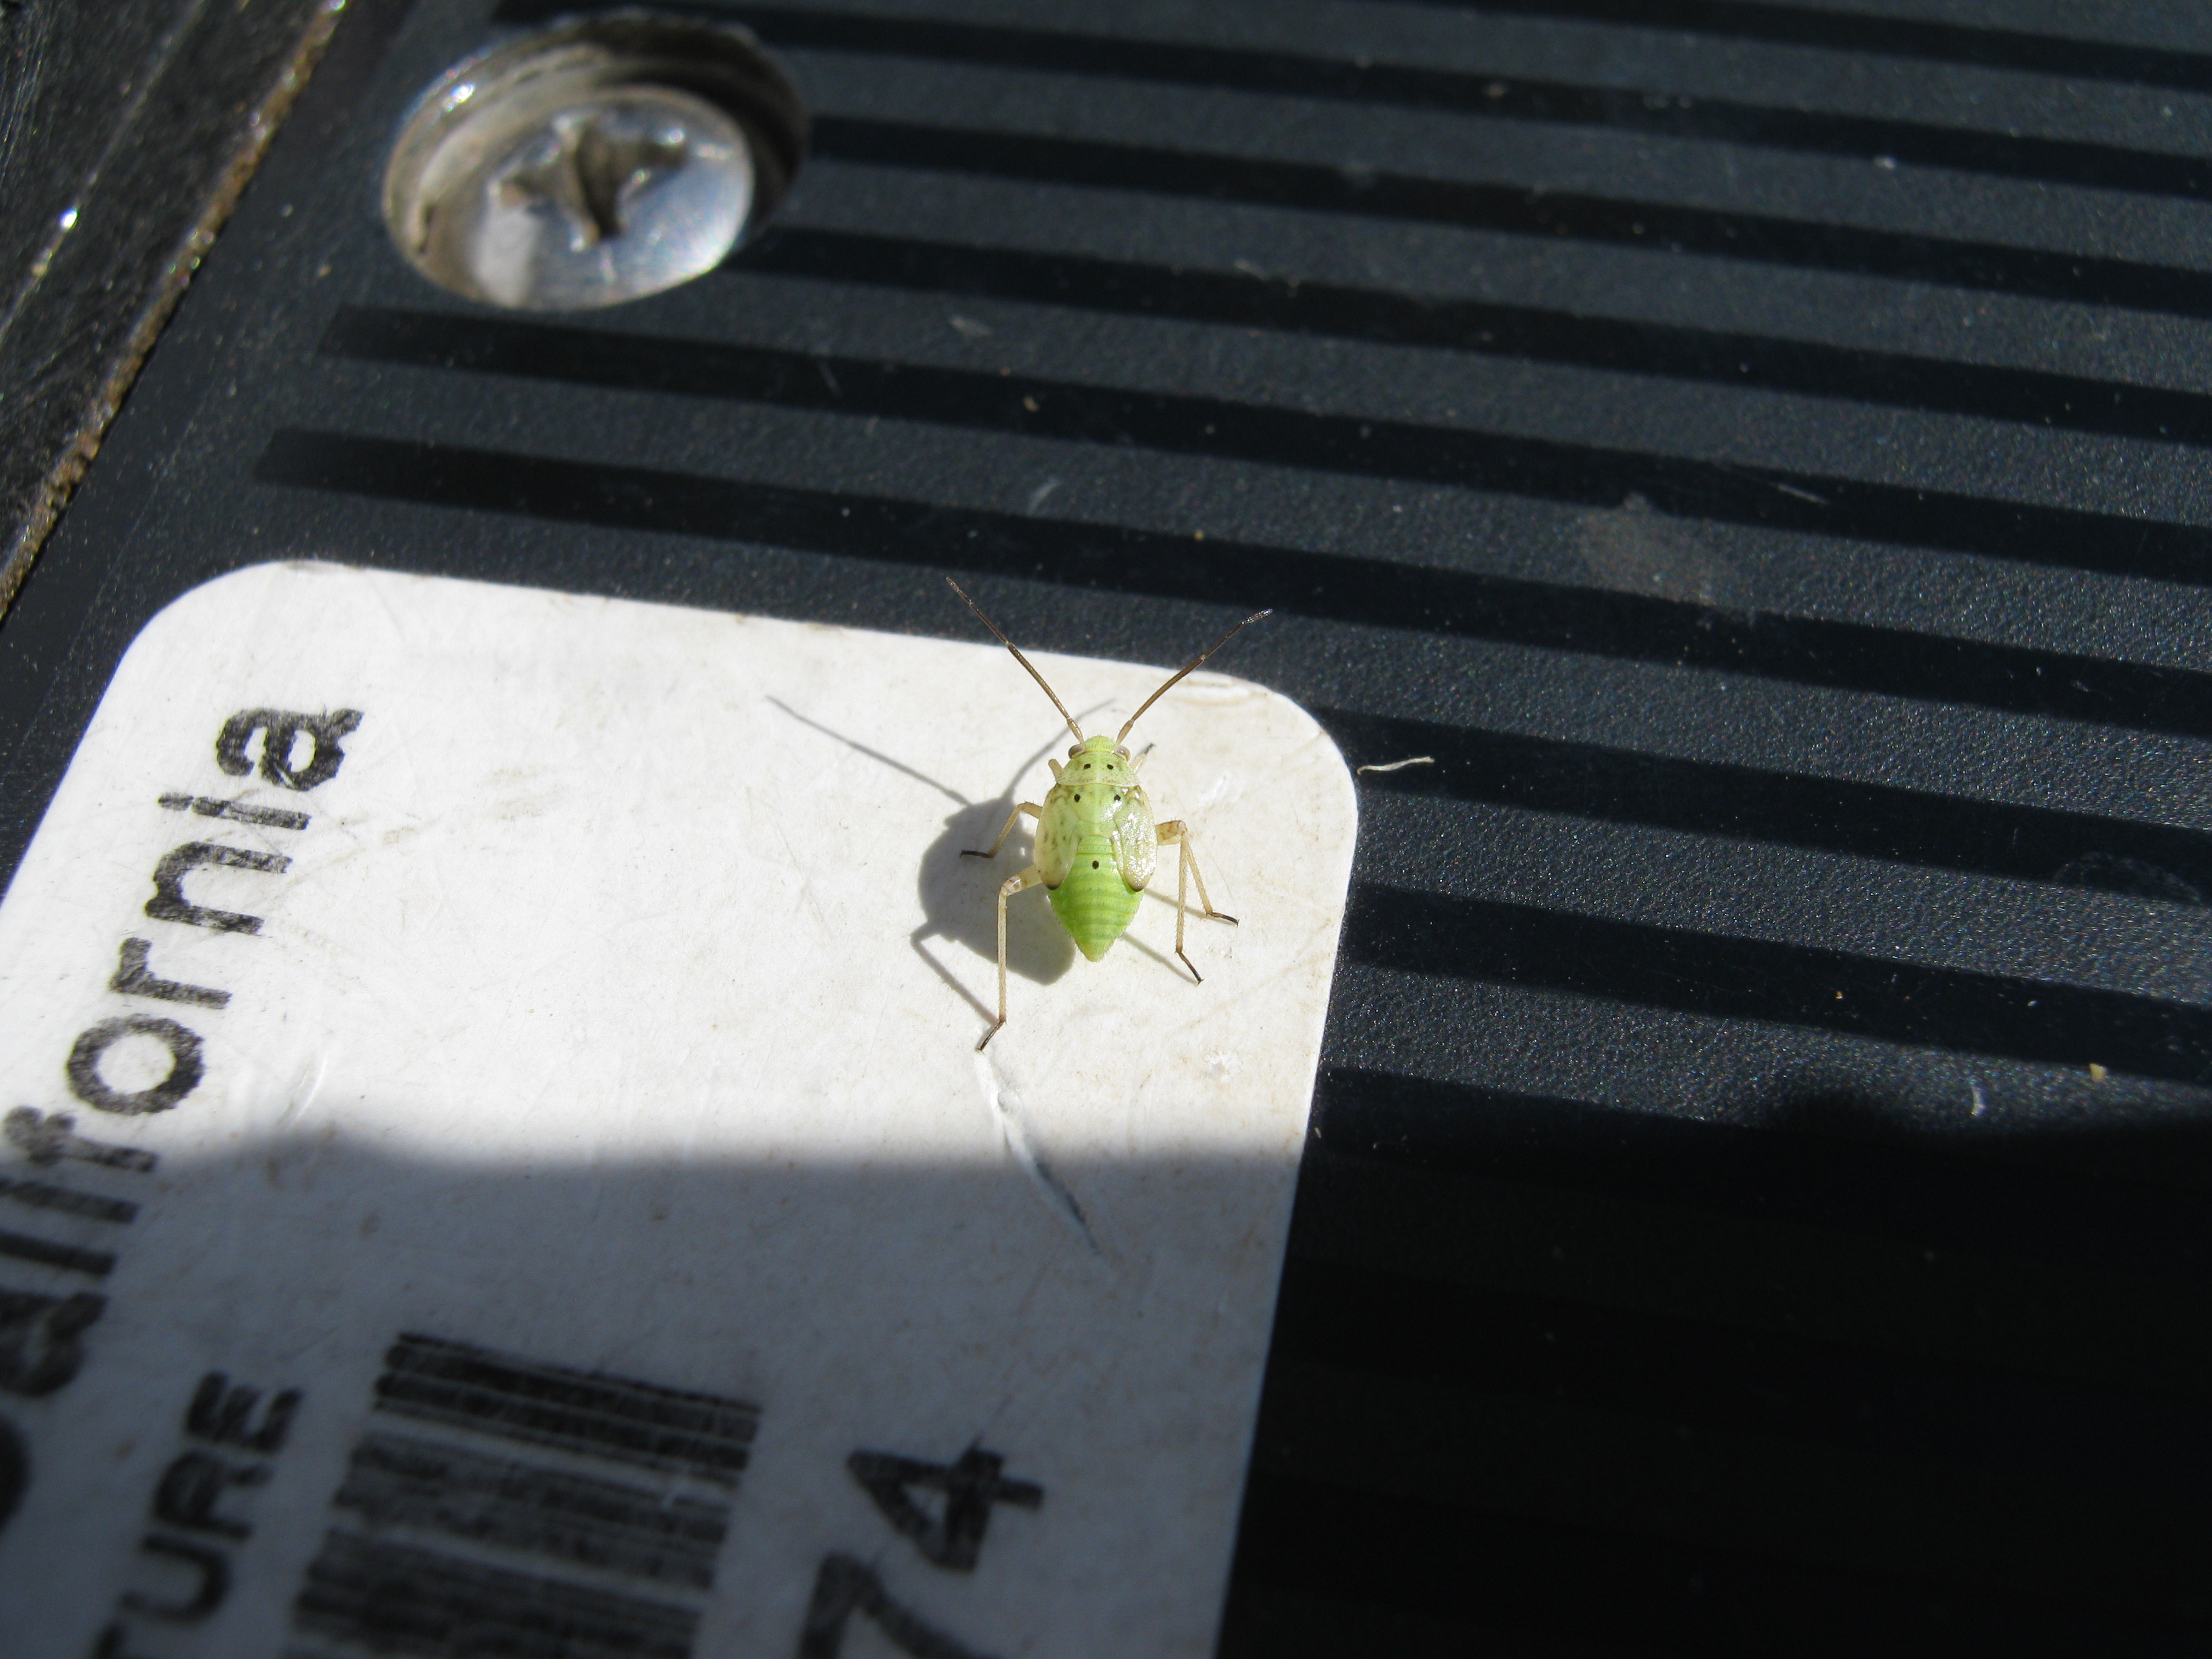
20100811SI_Bug.jpg ( 2010-08-11 09:53:38 ) Full size: 3648x2736
Green bug on property tag
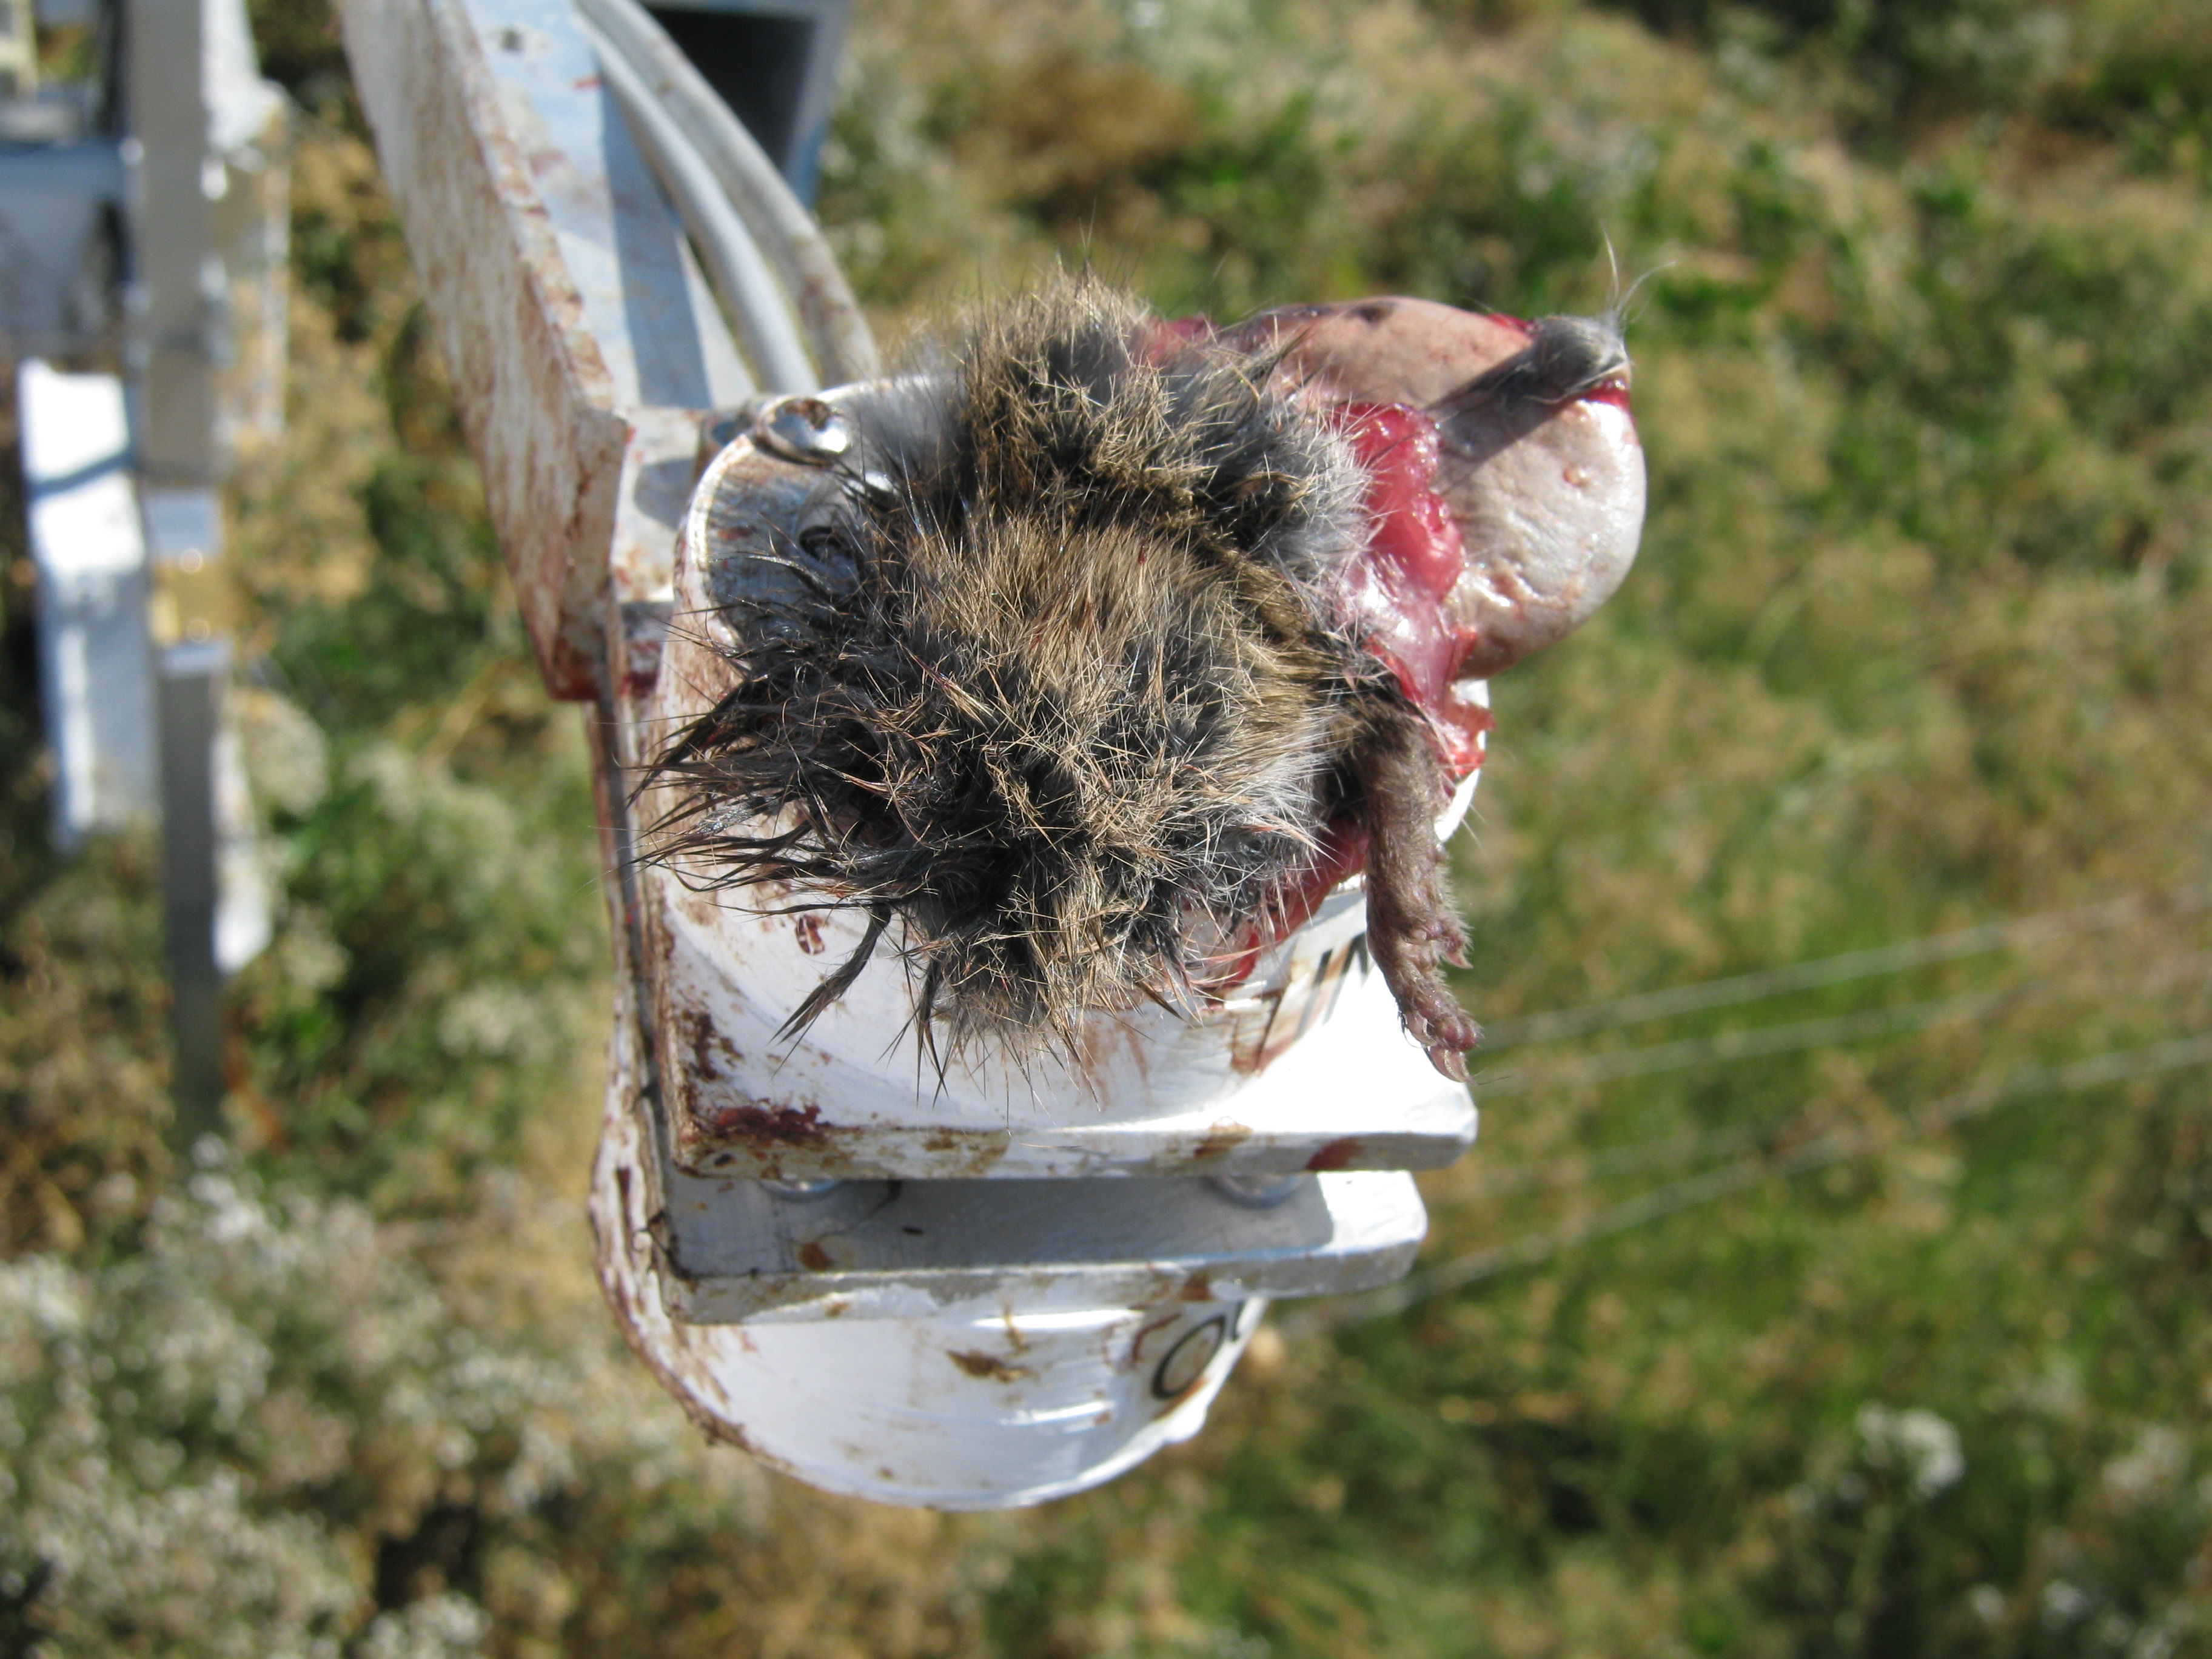
20100811SI_LEDSensorCarrion1.jpg ( 2010-08-11 10:29:58 ) Full size: 3648x2736
Half eaten rodent on LED NDVI sensor
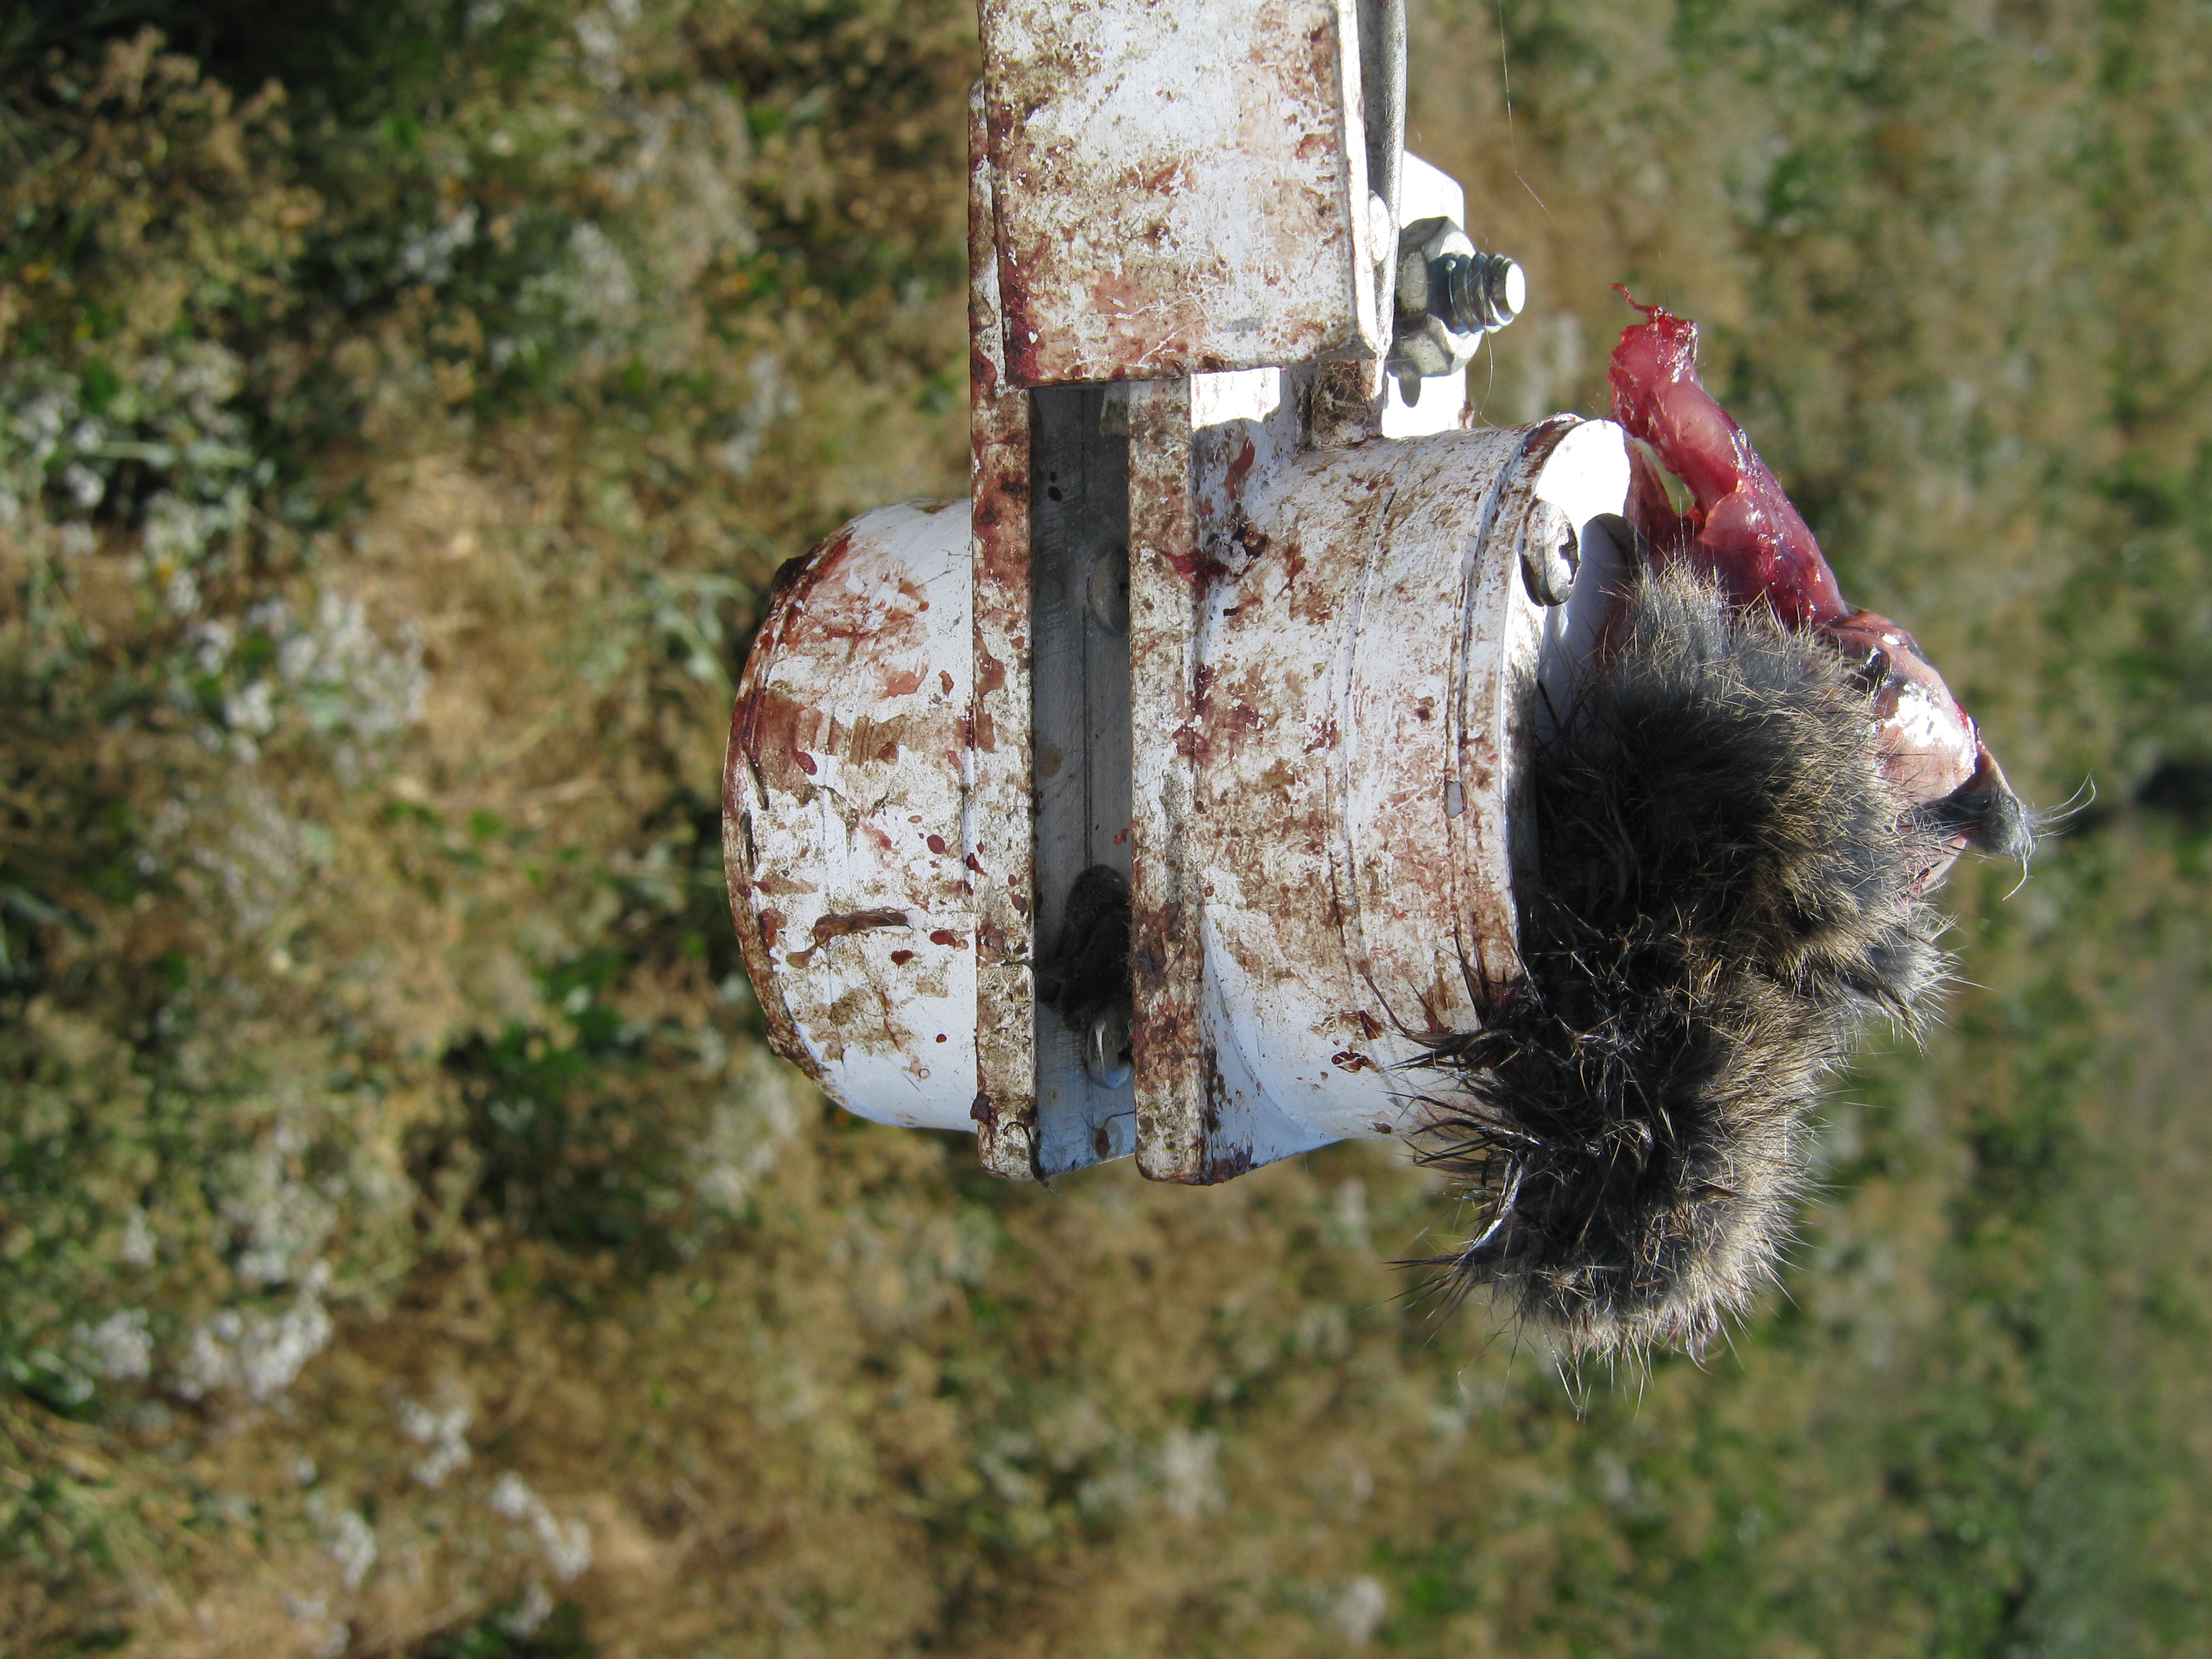
20100811SI_LEDSensorCarrion2.jpg ( 2010-08-11 10:30:16 ) Full size: 3648x2736
Half eaten rodent on LED NDVI sensor
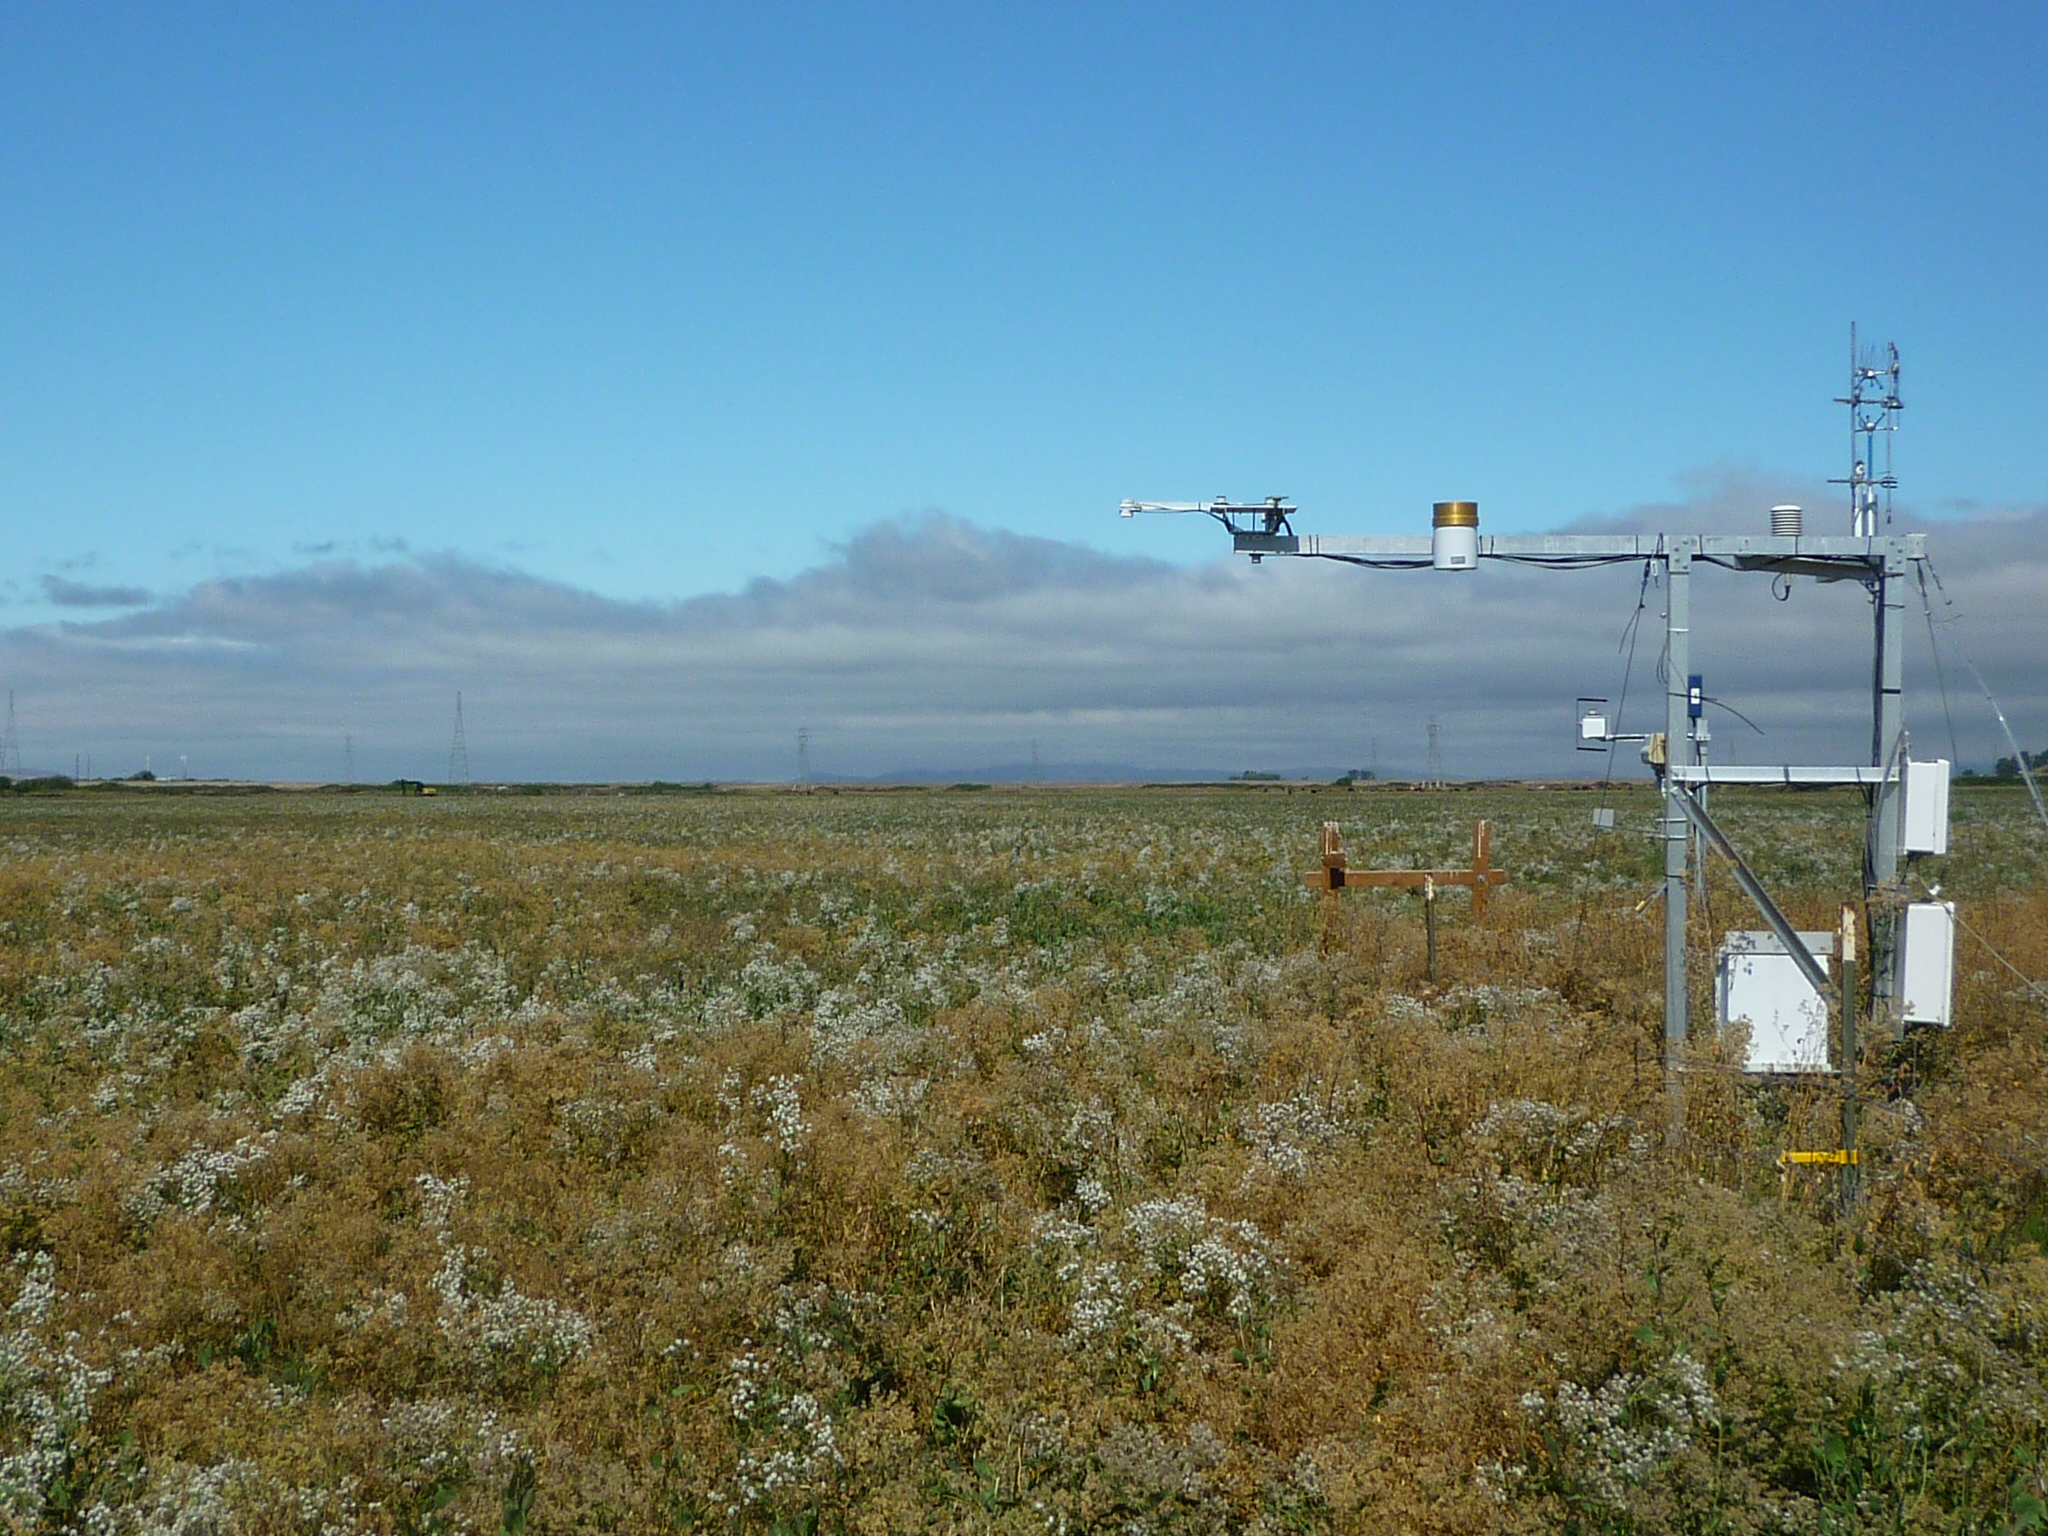
SI_P1000160.jpg ( 2010-08-11 09:52:44 ) Full size: 2048x1536
Sherman eddy tower and clouds on west horizon
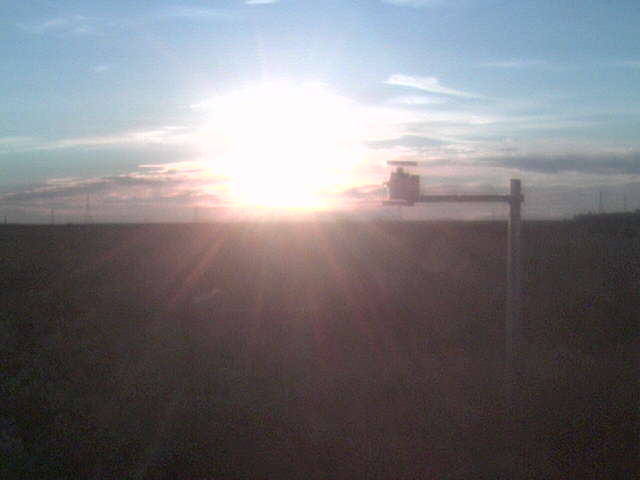
SI_webcam_20102221845.jpg ( 2010-08-10 18:45:06 ) Full size: 640x480
Sun setting into clouds.
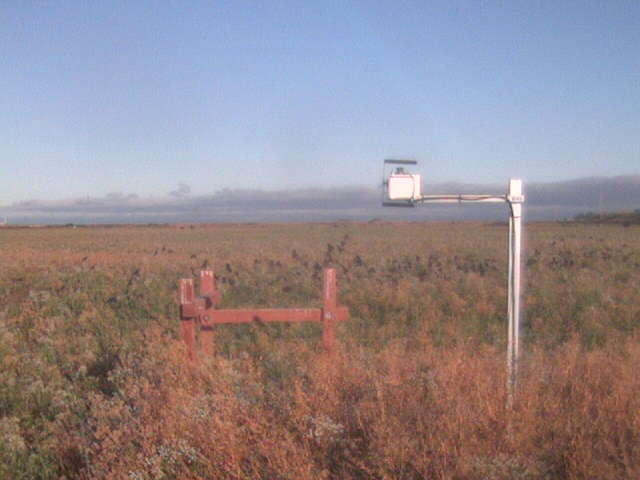
SI_webcam_20102230645.jpg ( 2010-08-11 06:45:02 ) Full size: 640x480
Black birds in the field.
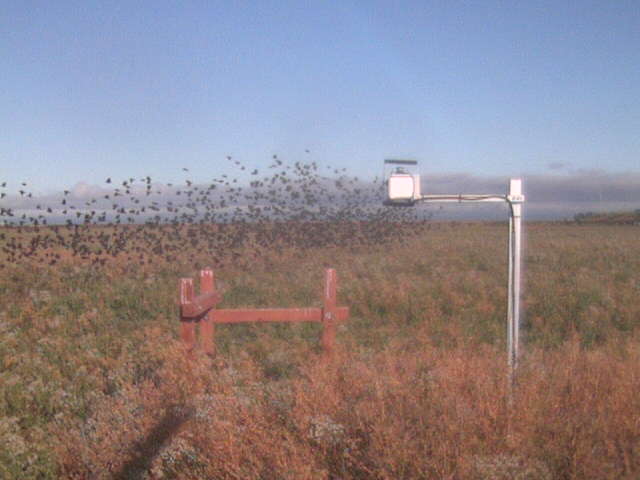
SI_webcam_20102230715.jpg ( 2010-08-11 07:15:06 ) Full size: 640x480
Black bird flock
7 sets found
1 SI_mp graphs found
11 SI_met graphs found
Can't check SI_mixed
2 SI_mixed graphs found
5 SI_flx graphs found
2 SI_soilco2 graphs found
Can't check TWSI_mixed
Can't check SIMBTWEE_met