
Field Notes
<--2010-08-11 09:15:00 | 2010-08-17 12:00:00-->Other sites visited today: Sherman Island | Twitchell Rice | Twitchell Rice
Phenocam link: Searching...
Sherman Island: 2010-08-11 09:30:00 (DOY 223)
Author: Joe Verfaillie
Others: Jaclyn
| Sherman
8/11/2010 Arrived about 9:30am PDT with Jaclyn. It was cool and windy with clear skies and sun. A fog bank to the west seemed to get bigger, closer but then fell apart later. Bridge work continues. There are cows in the west end of the field. The west end ditches also had water. The field looks greener with new pepper weed flowers. LGR was okay pressure was adjusted with the bypass valve from 129.53 to 147.0 8:25PST, 25.04C, 147.0Torr, 15.647usec, 10Hz, 1.811ppm still on diaphragm pump Moisture point probes: Inside cow fence east side three readings 19.1 18.8 20.0 39.0 37.8 38.7 46.9 45.5 47.2 sat sat sat Inside cow fence west side two readings – reader battery died – need to recharge 8.8 8.3 33.5 32.9 41.9 41.3 sat sat A hawk left a portion of some rodent on top of the LED NDVI sensor. Copied and collected data. Cleaned radiometers. |
8 photos found
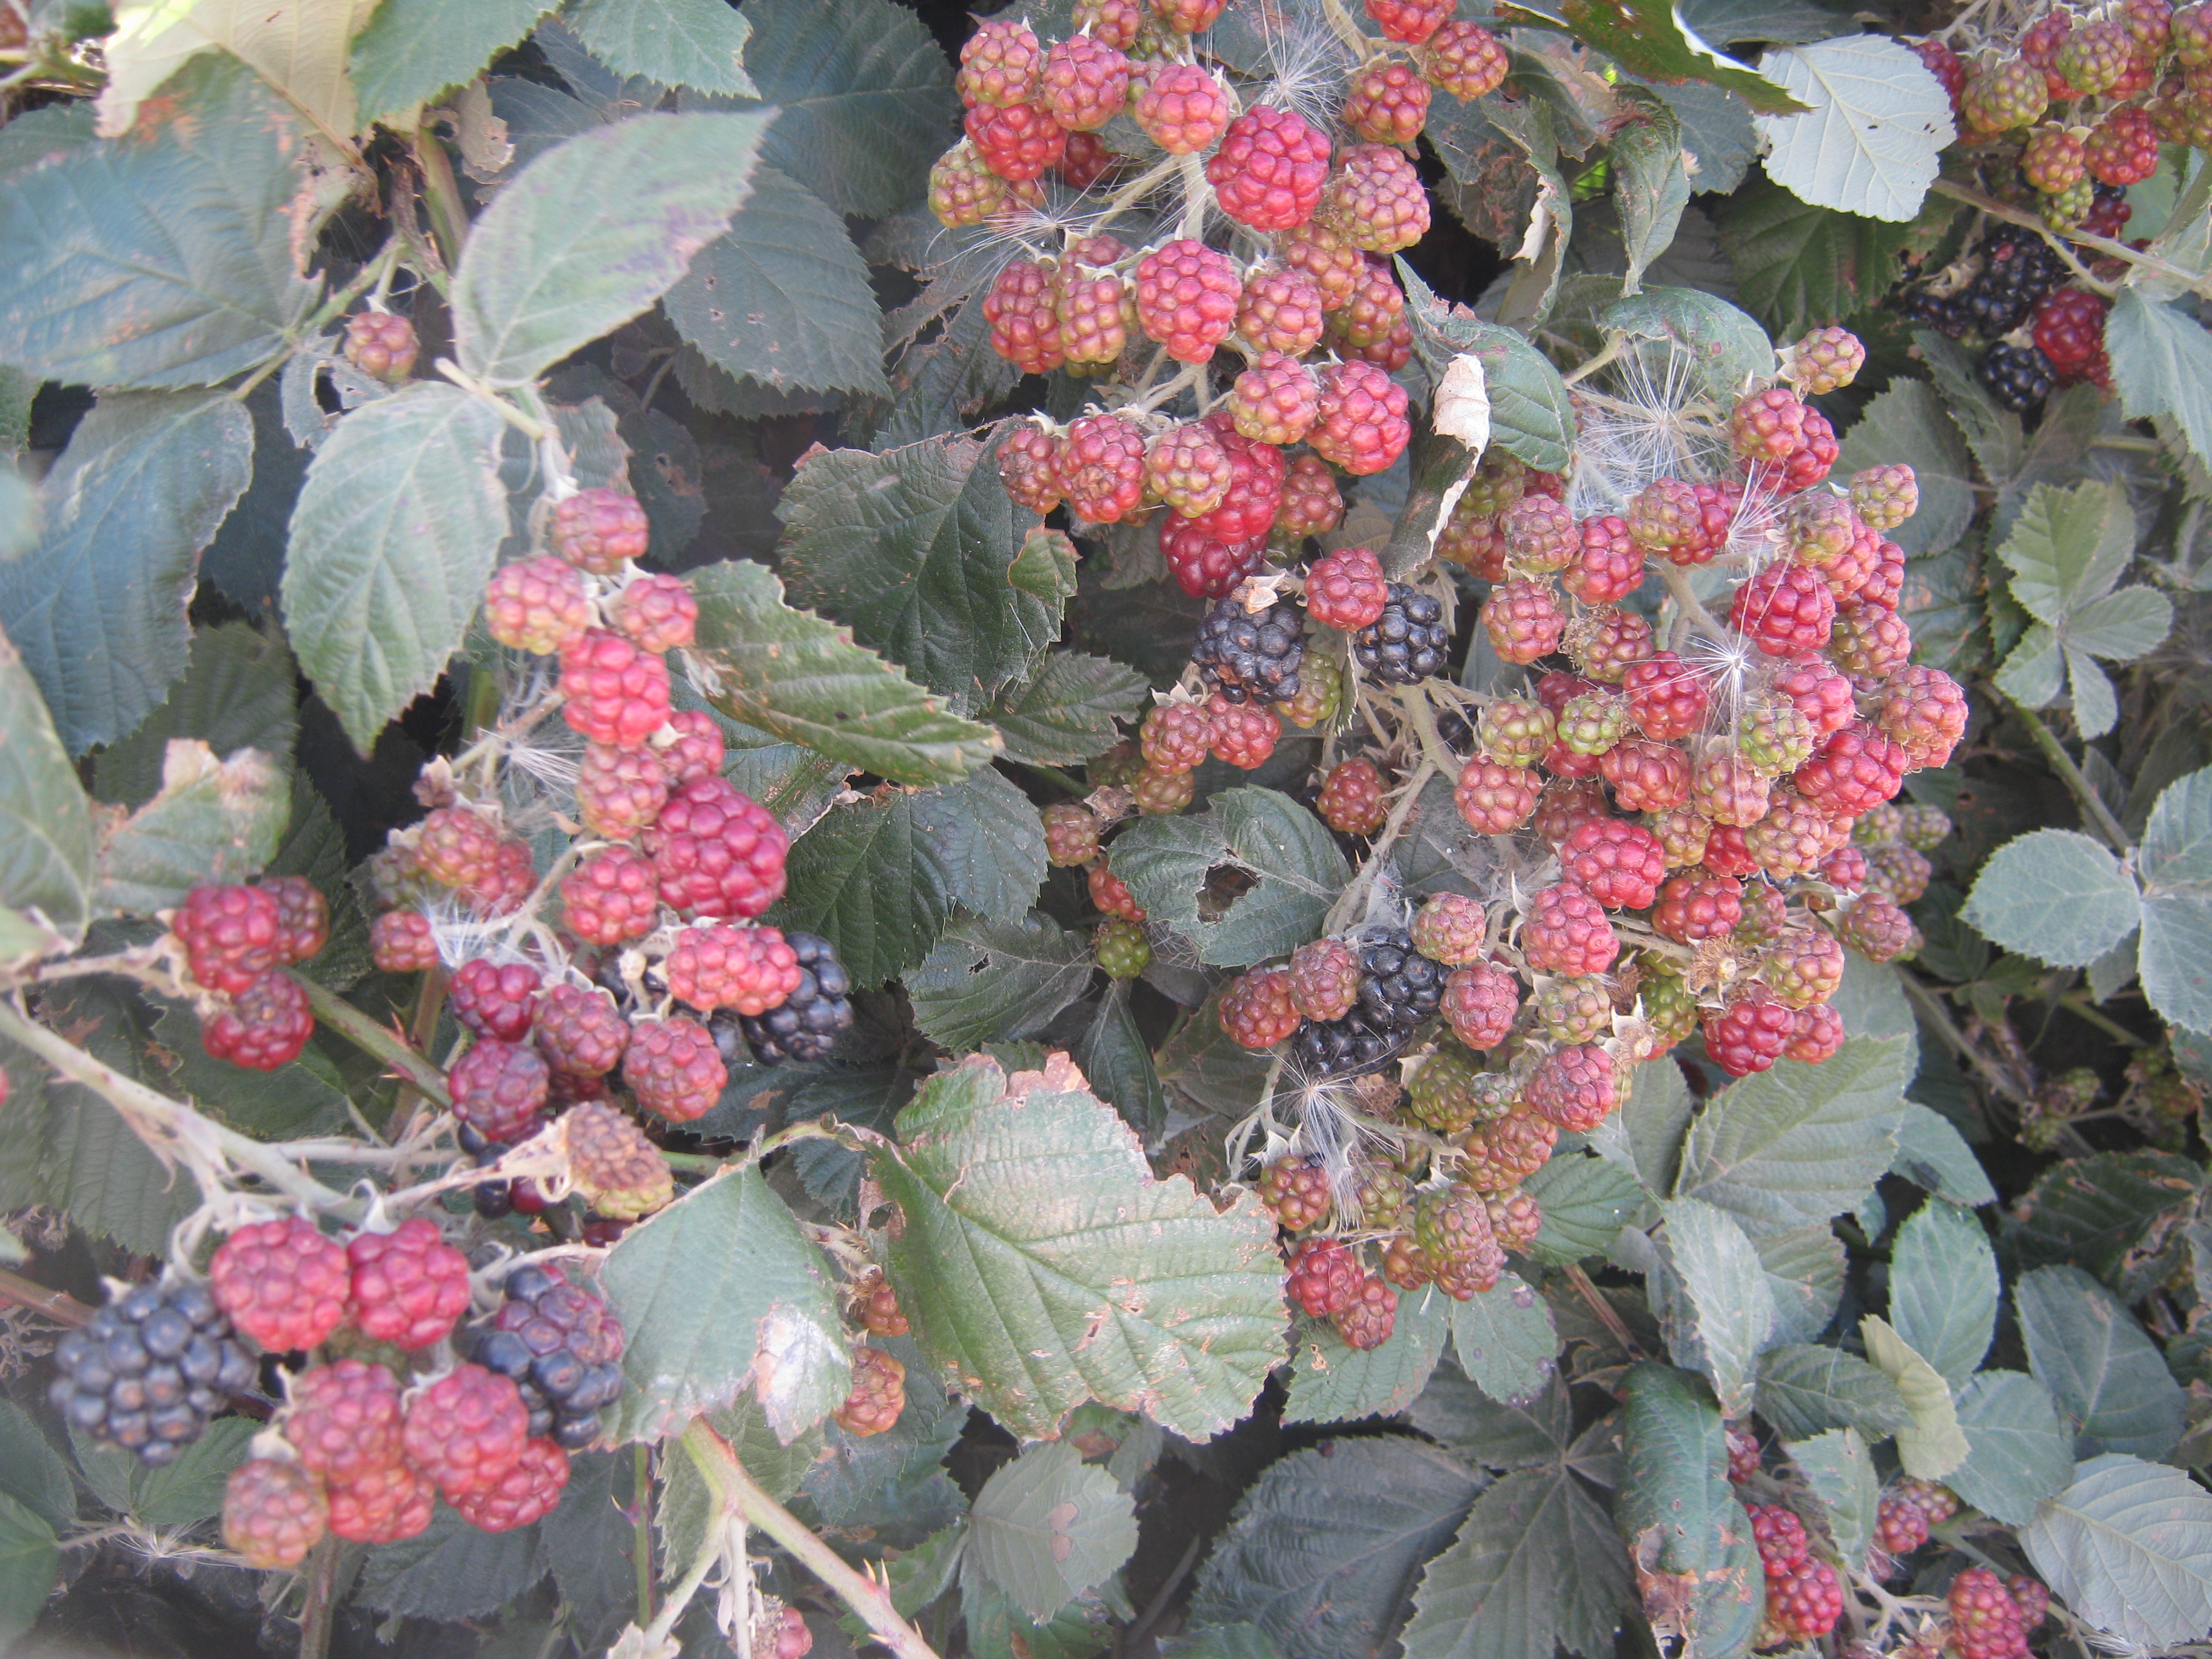
20100811SI_Blackberries.jpg ( 2010-08-11 10:51:40 ) Full size: 3648x2736
Bunches of blackberries
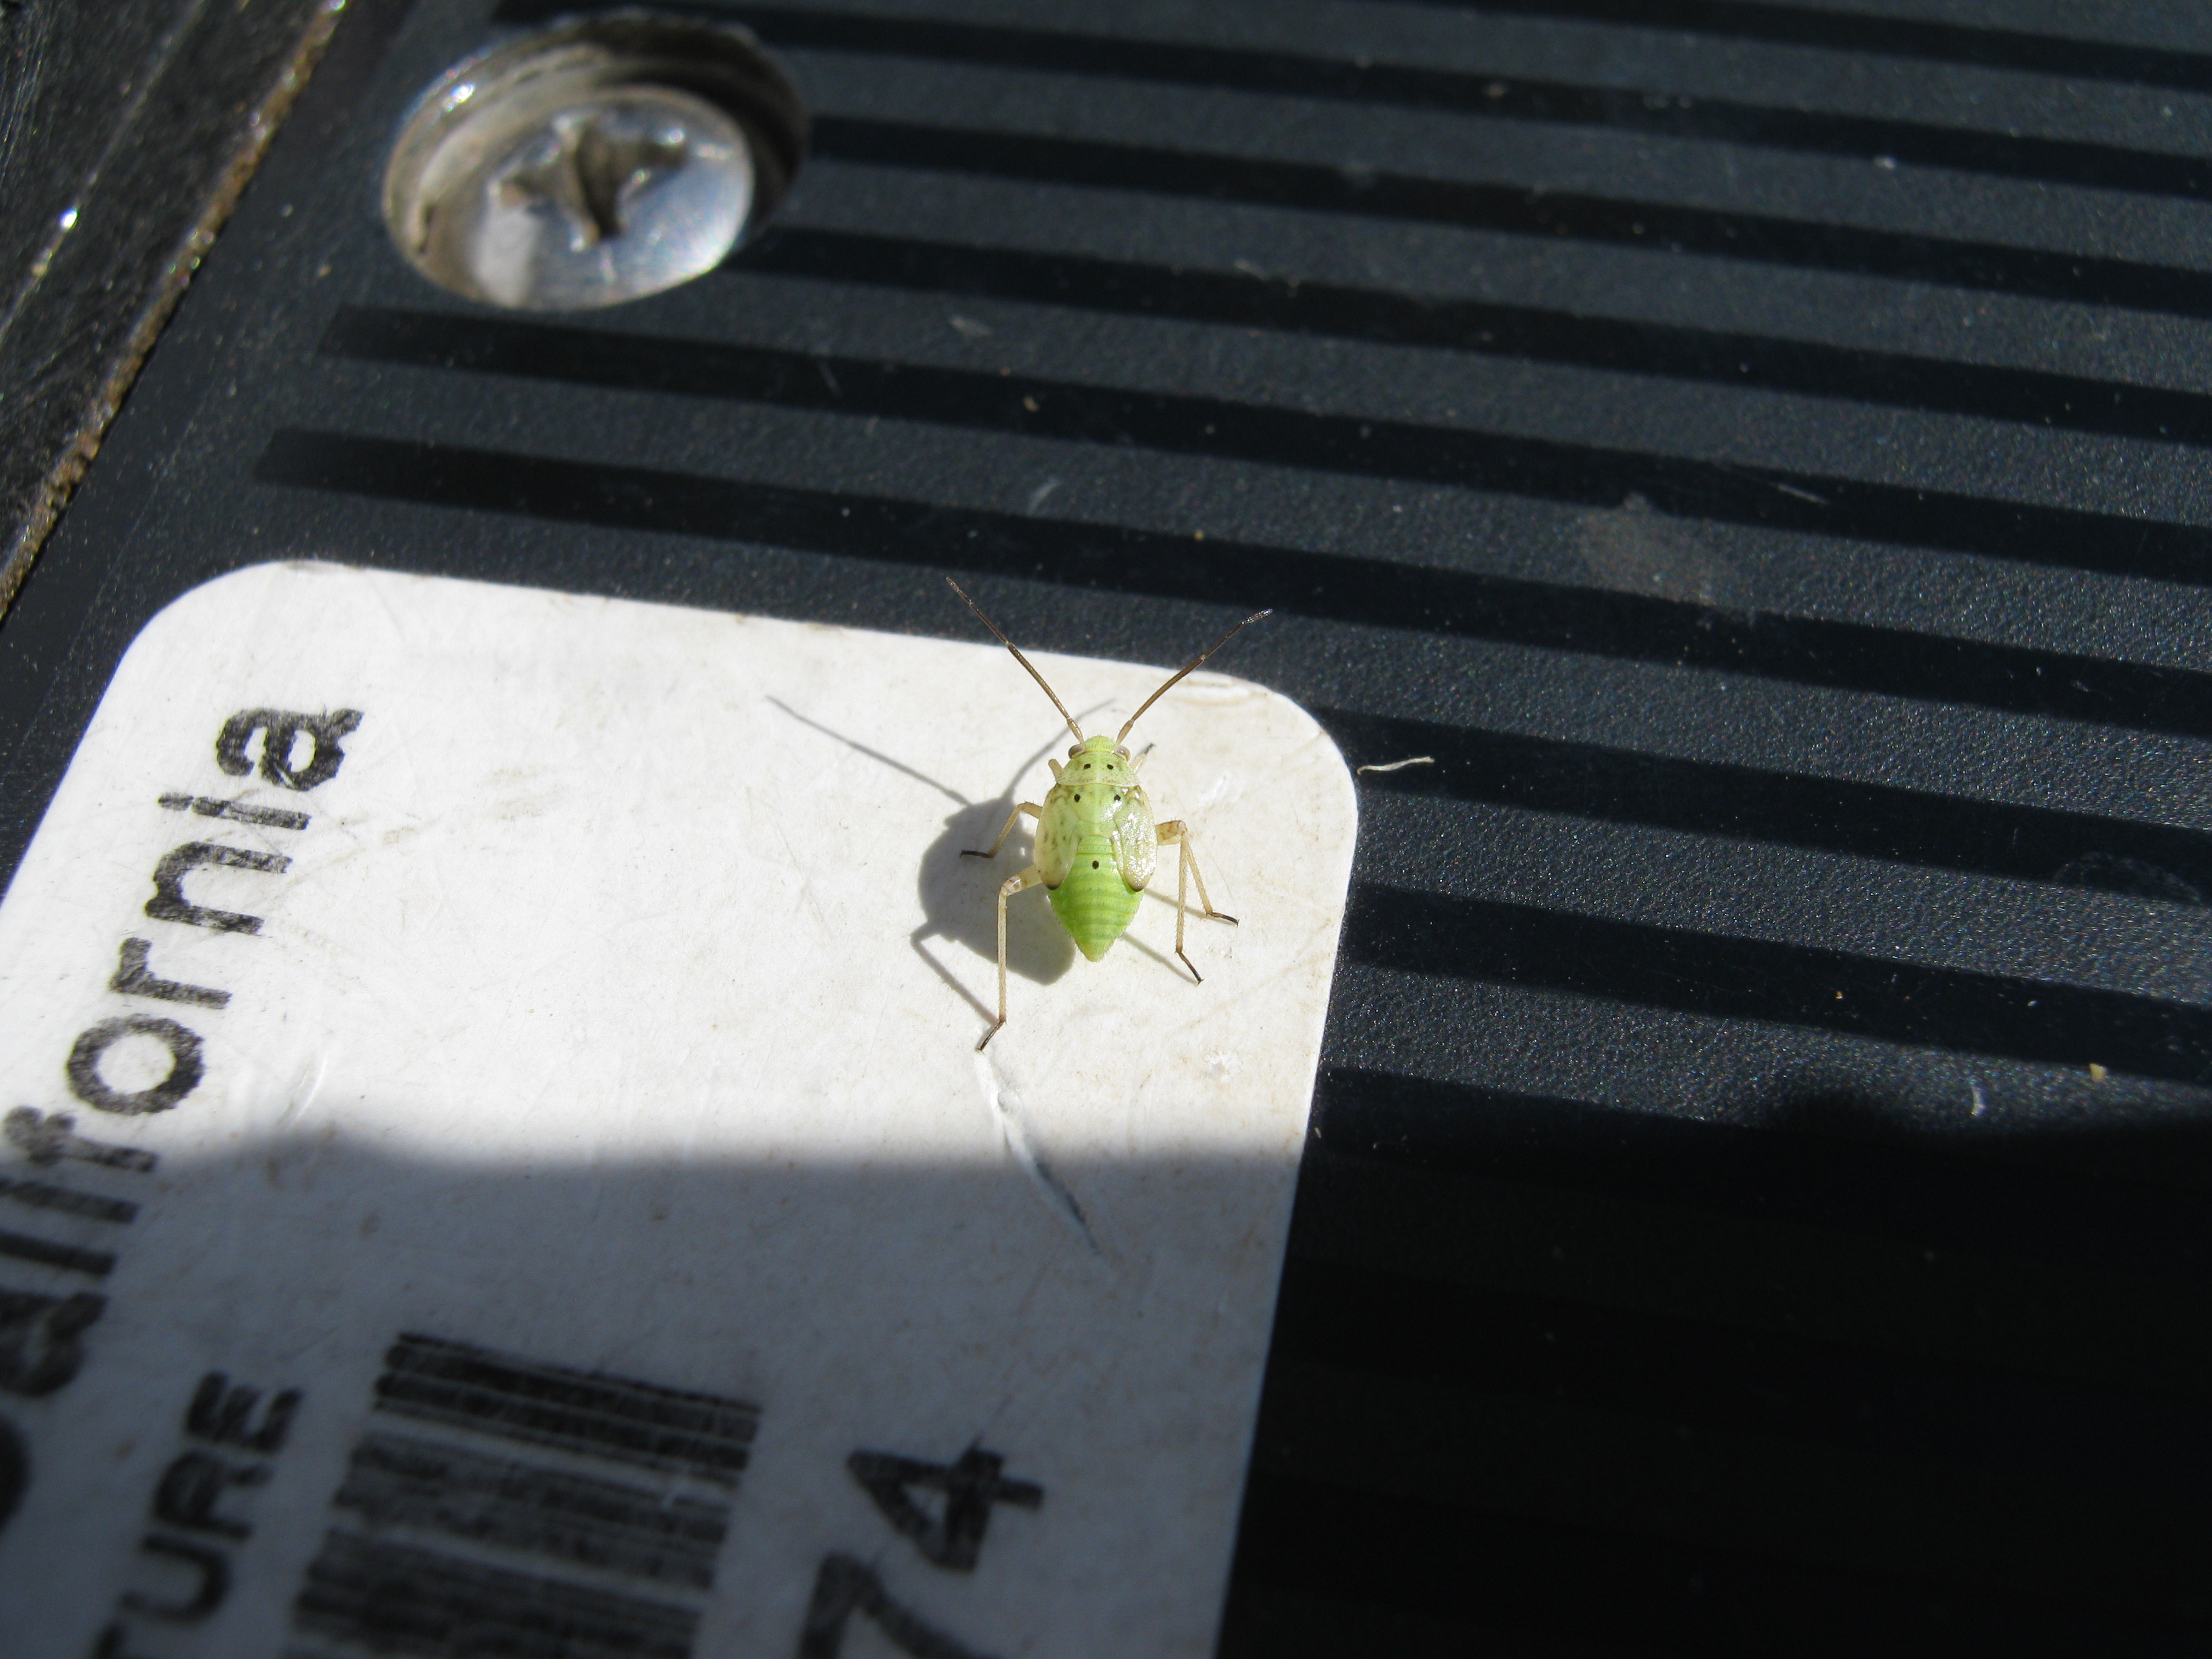
20100811SI_Bug.jpg ( 2010-08-11 09:53:38 ) Full size: 3648x2736
Green bug on property tag
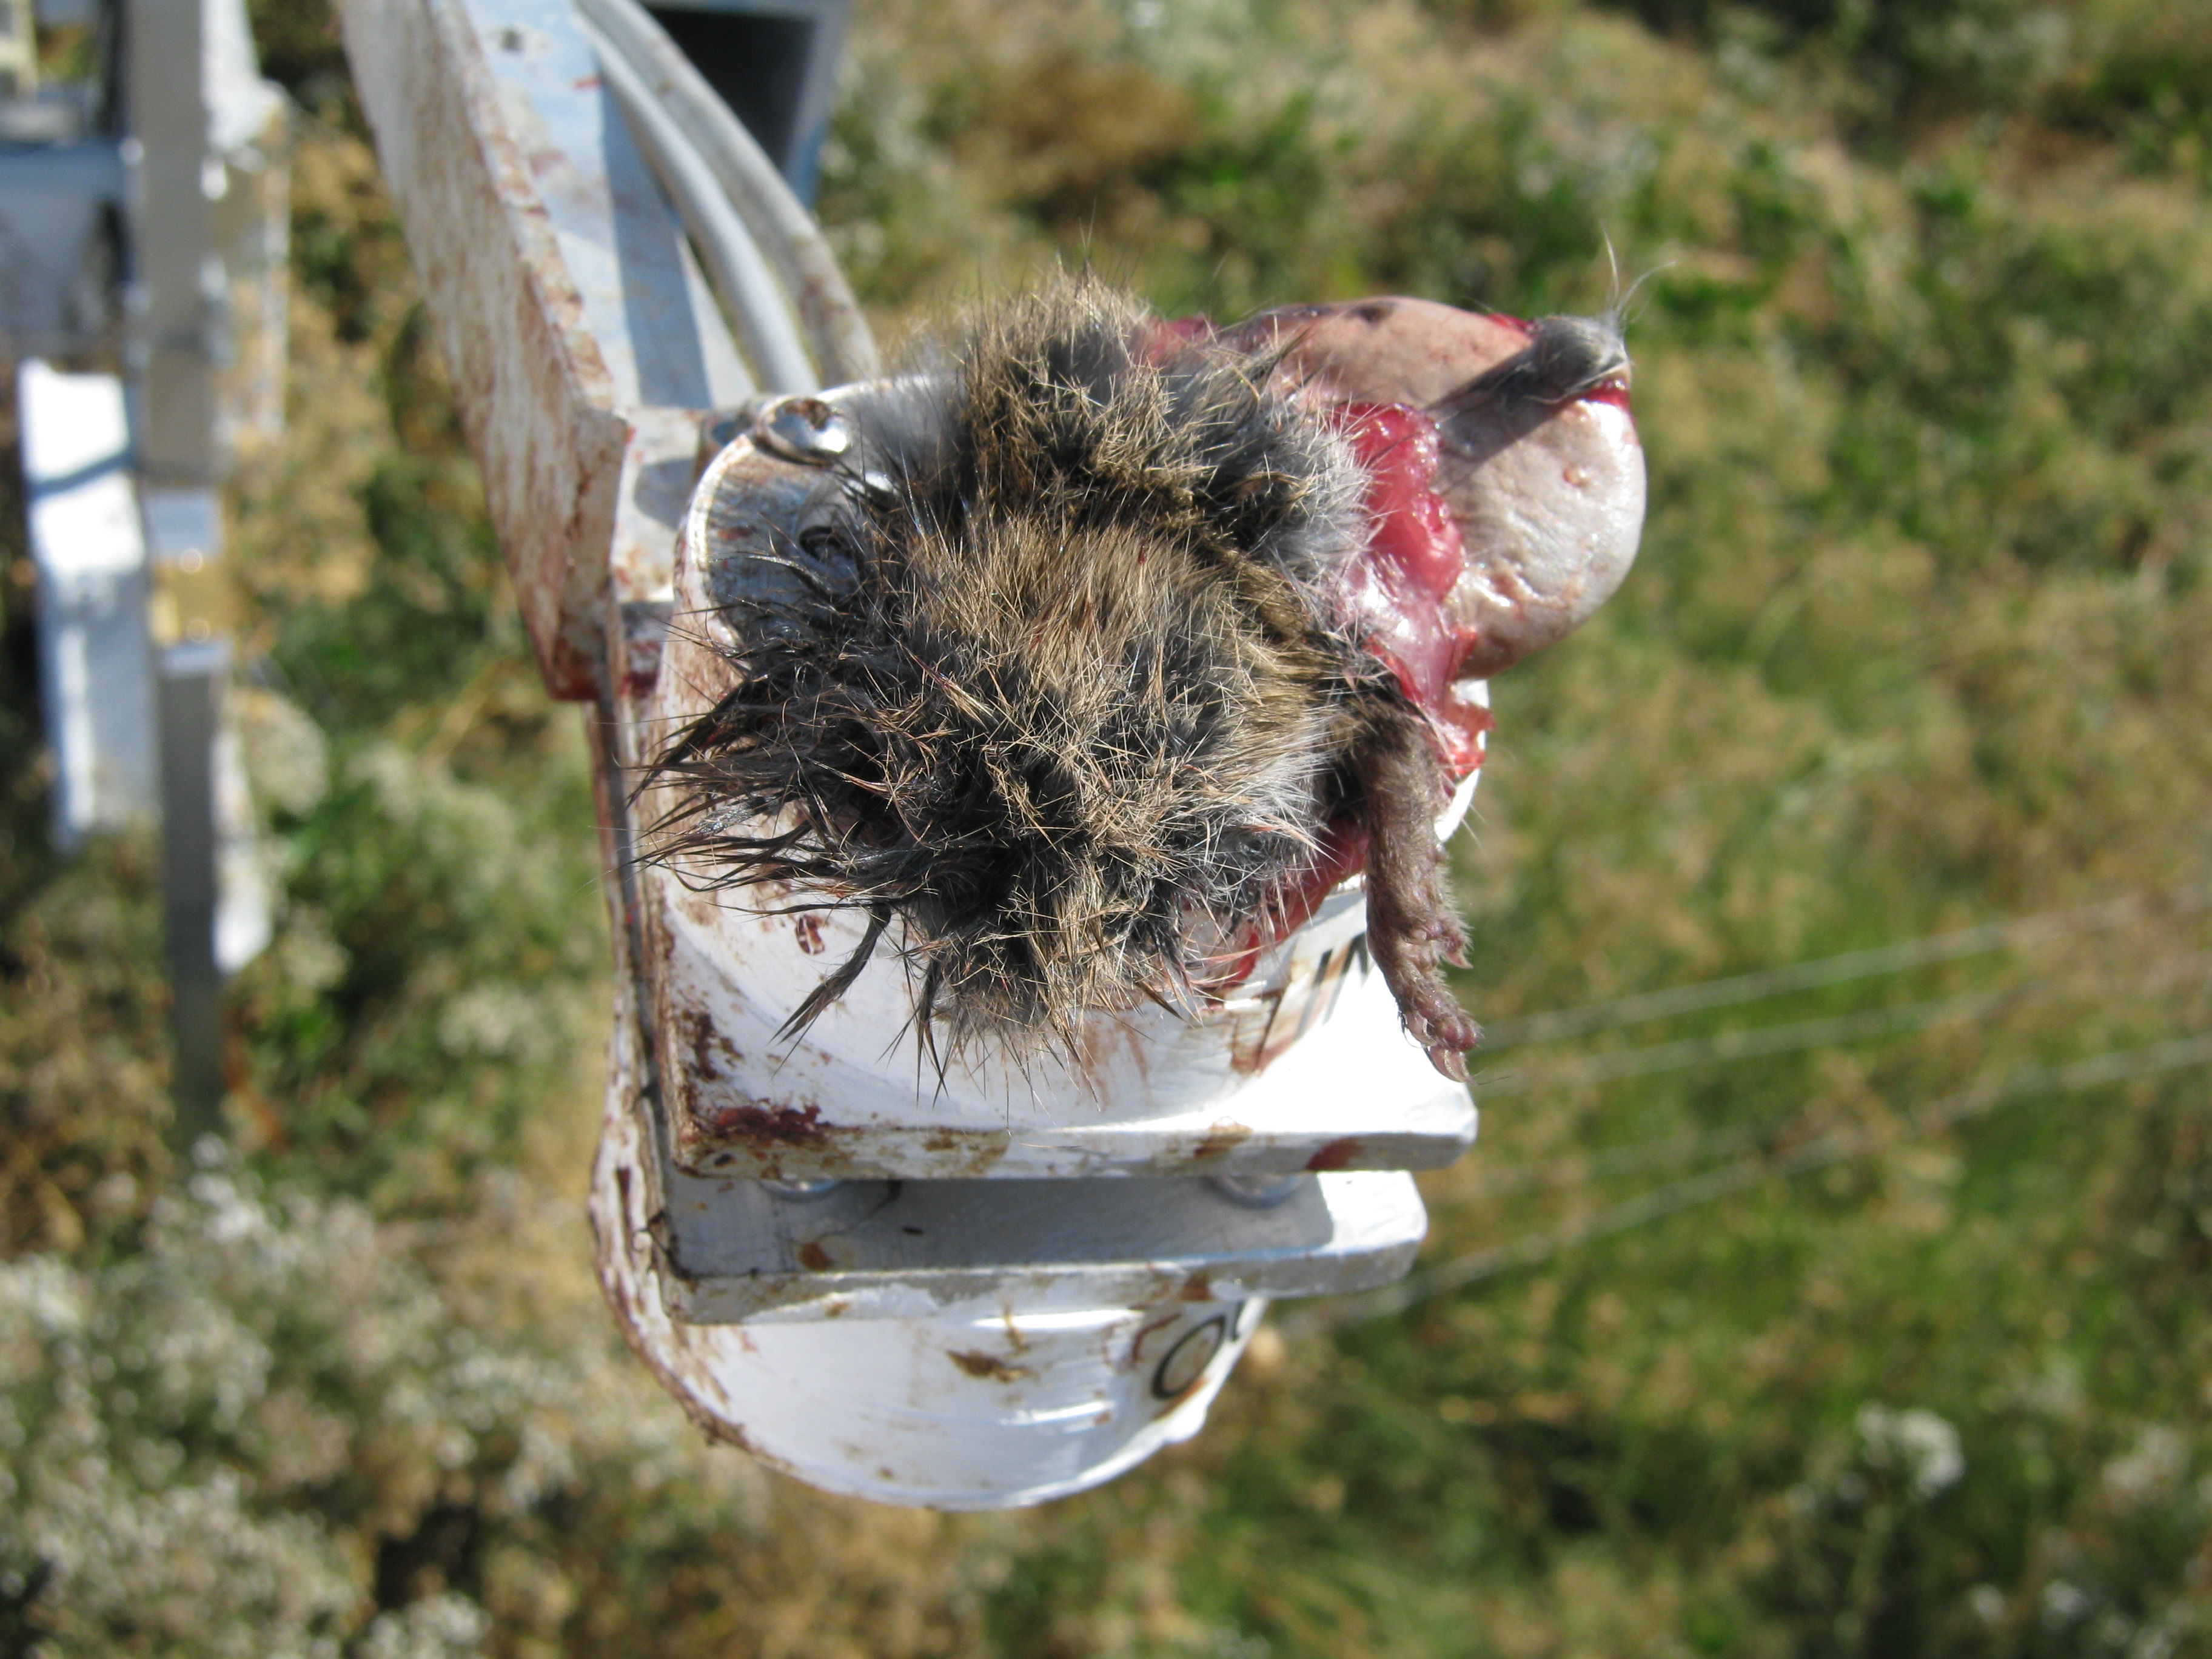
20100811SI_LEDSensorCarrion1.jpg ( 2010-08-11 10:29:58 ) Full size: 3648x2736
Half eaten rodent on LED NDVI sensor
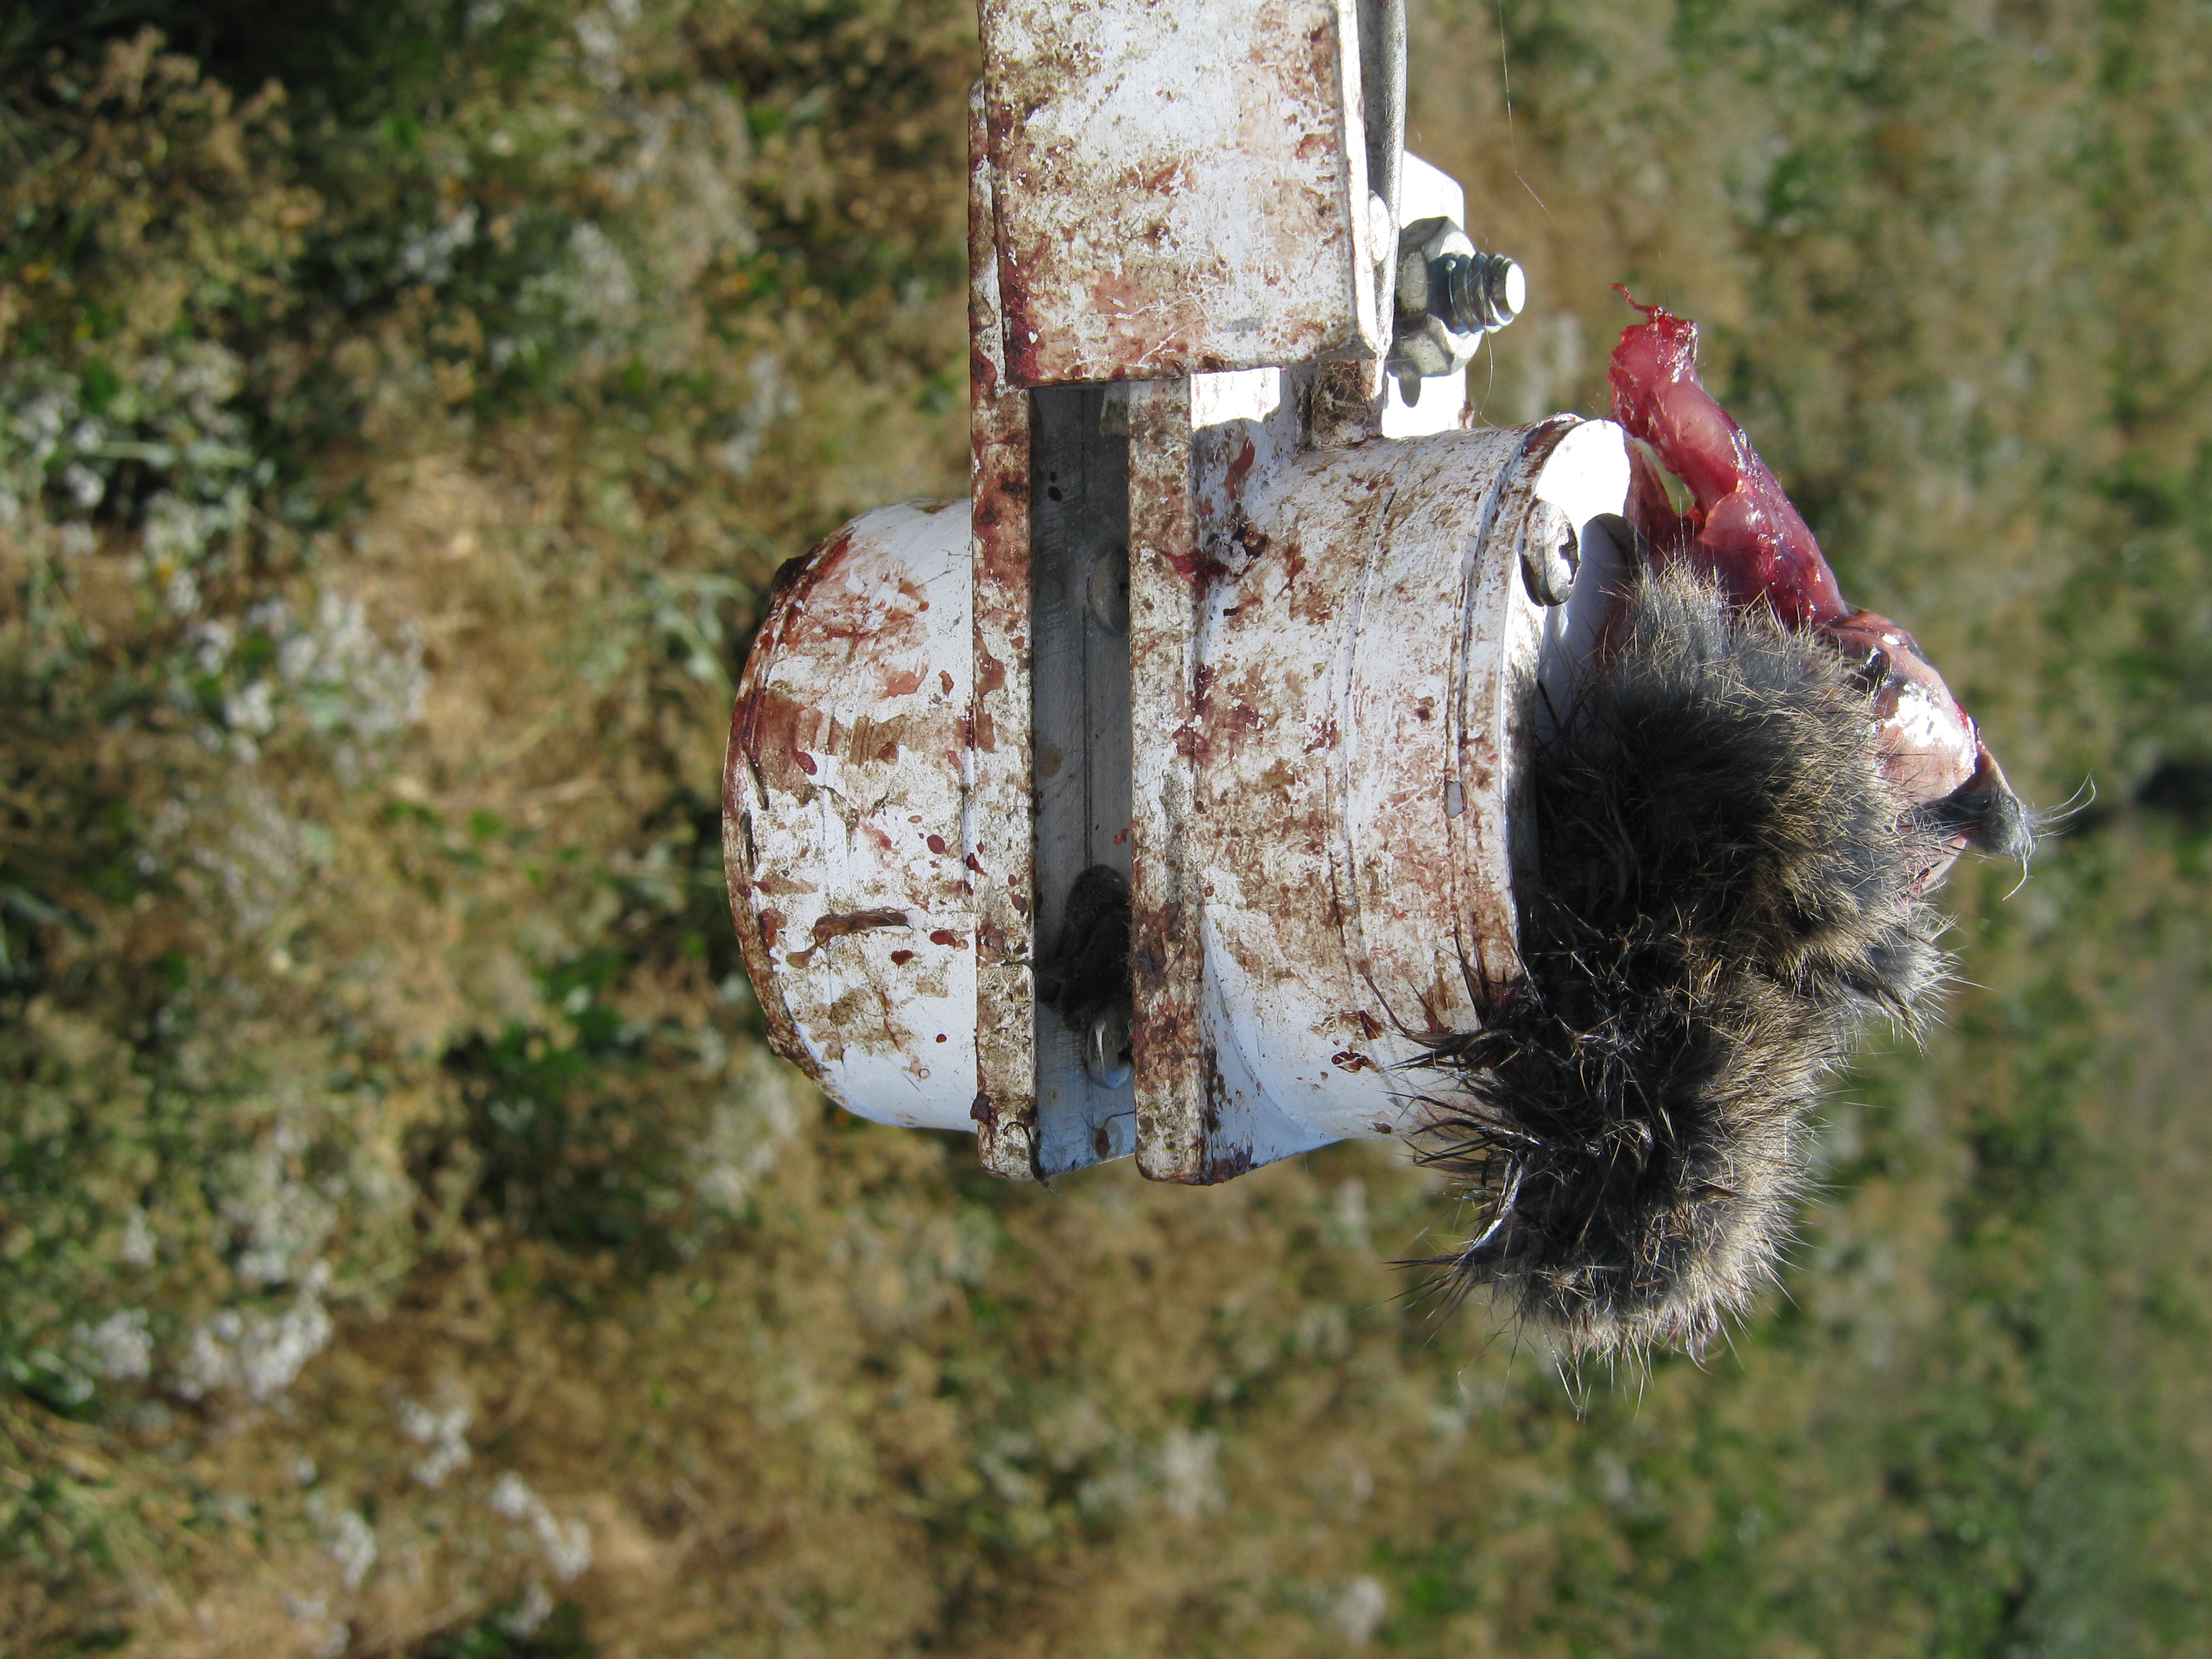
20100811SI_LEDSensorCarrion2.jpg ( 2010-08-11 10:30:16 ) Full size: 3648x2736
Half eaten rodent on LED NDVI sensor
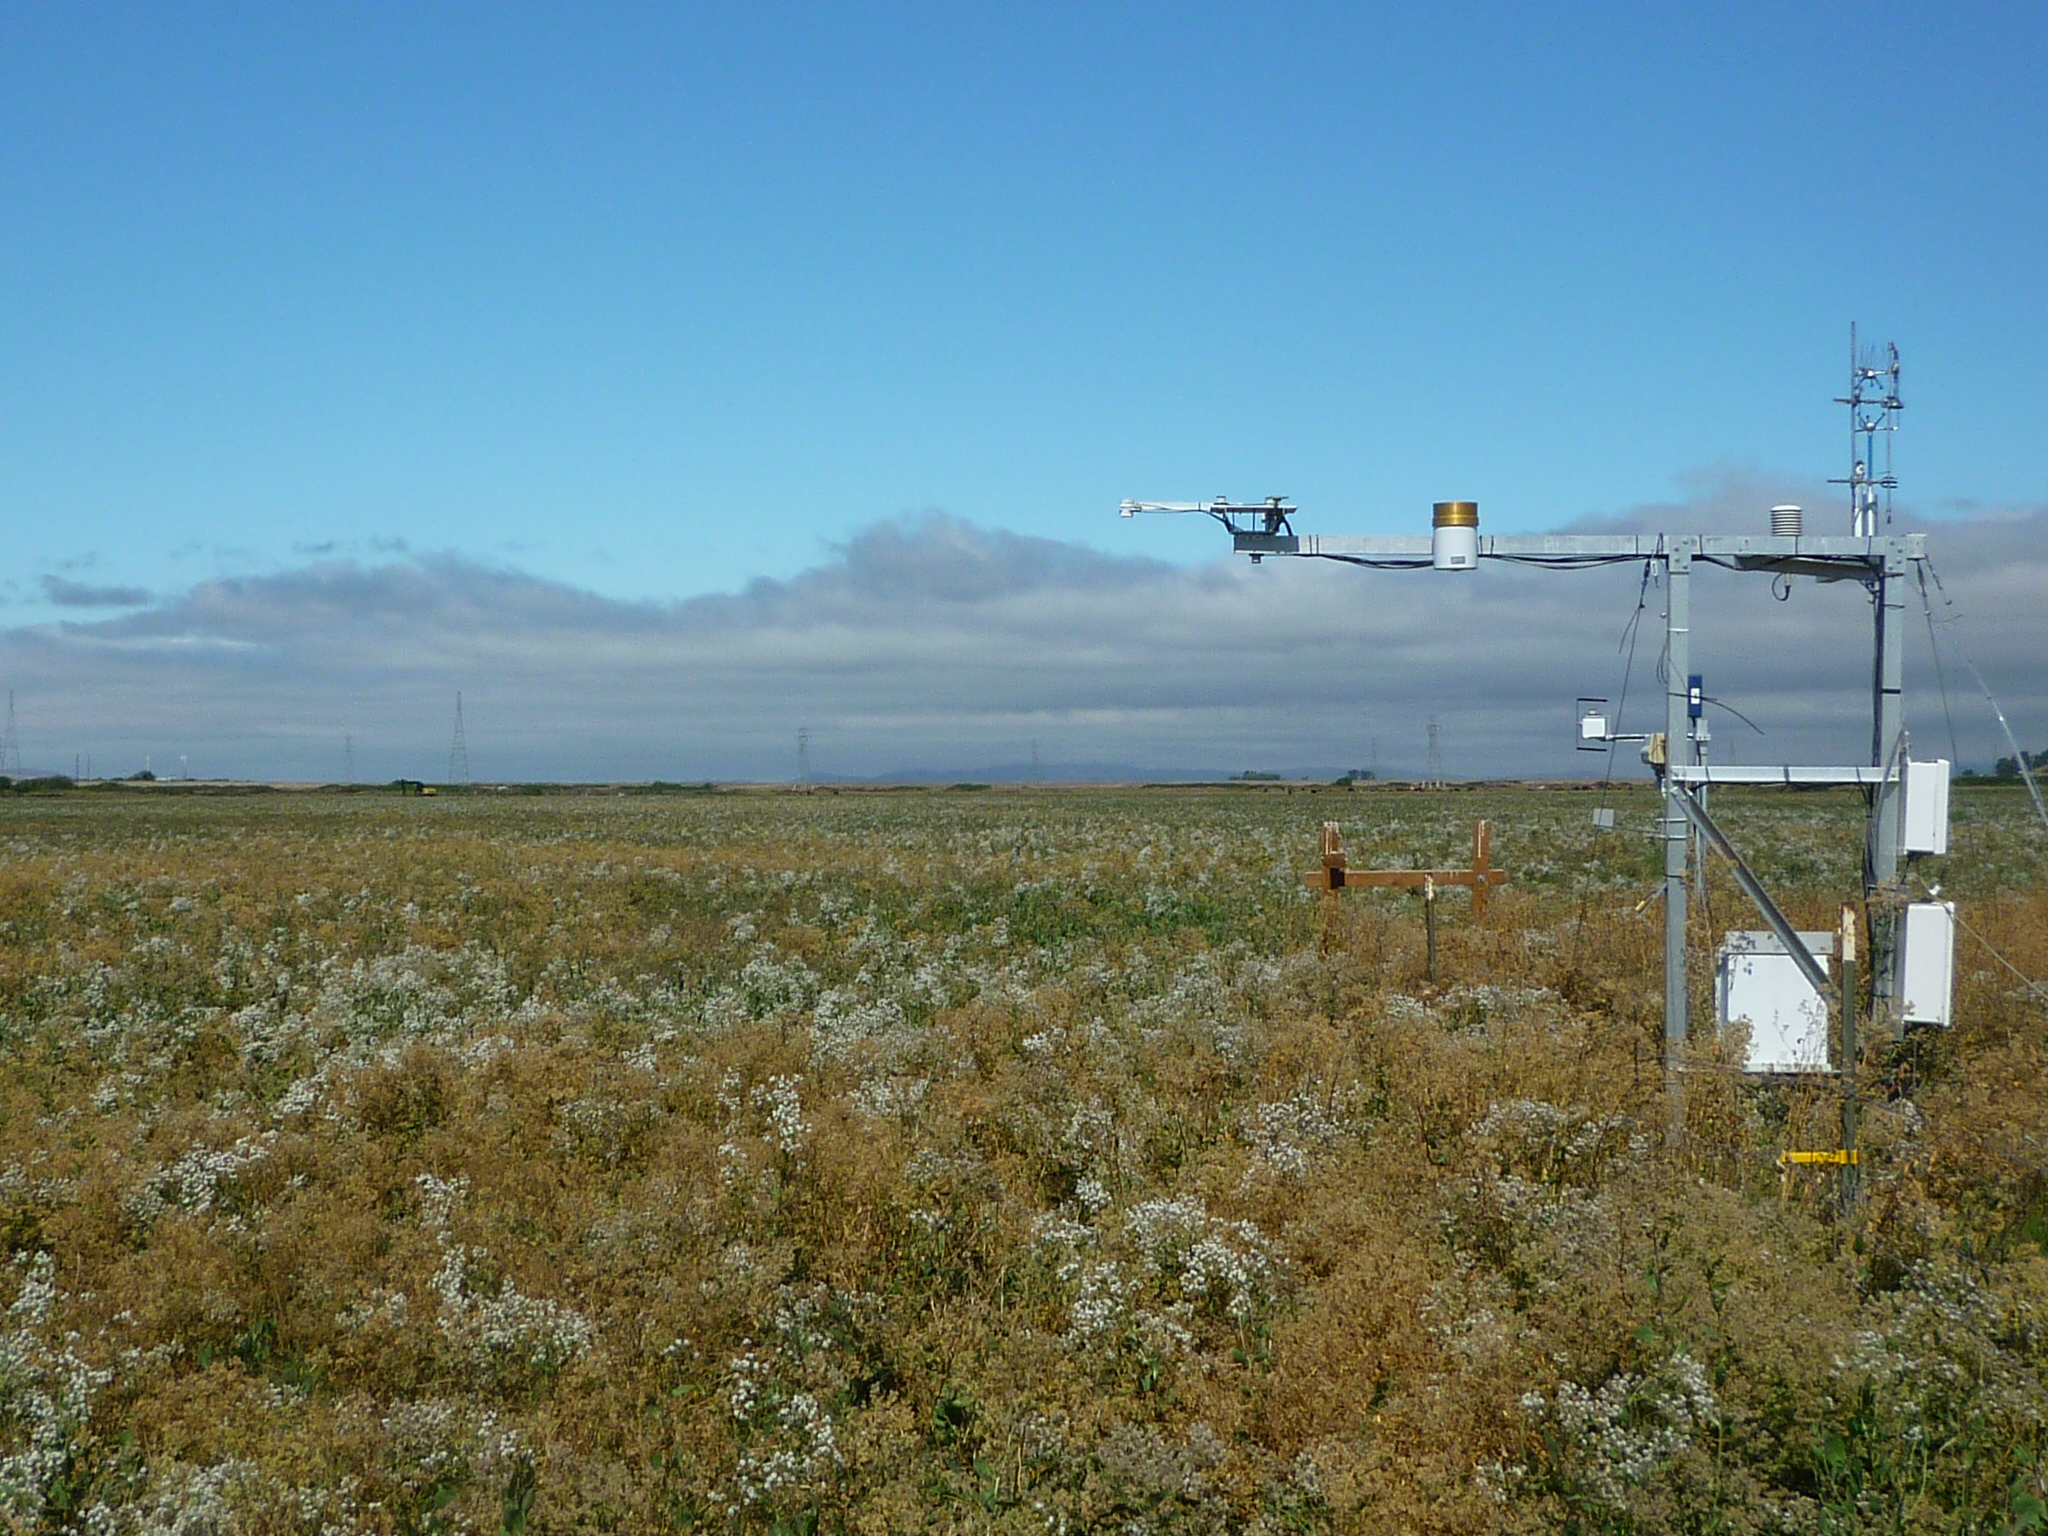
SI_P1000160.jpg ( 2010-08-11 09:52:44 ) Full size: 2048x1536
Sherman eddy tower and clouds on west horizon
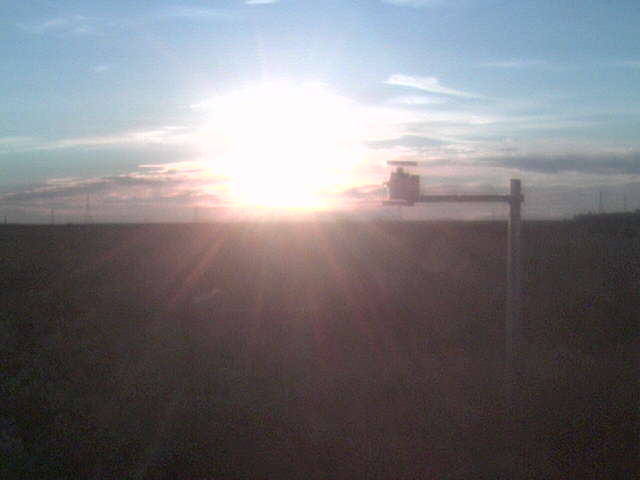
SI_webcam_20102221845.jpg ( 2010-08-10 18:45:06 ) Full size: 640x480
Sun setting into clouds.
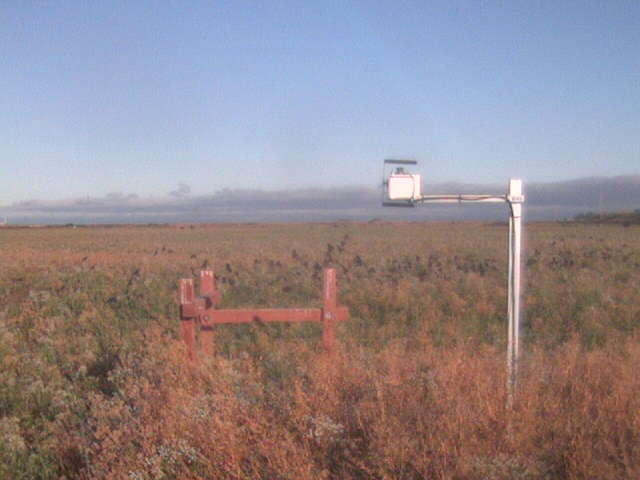
SI_webcam_20102230645.jpg ( 2010-08-11 06:45:02 ) Full size: 640x480
Black birds in the field.
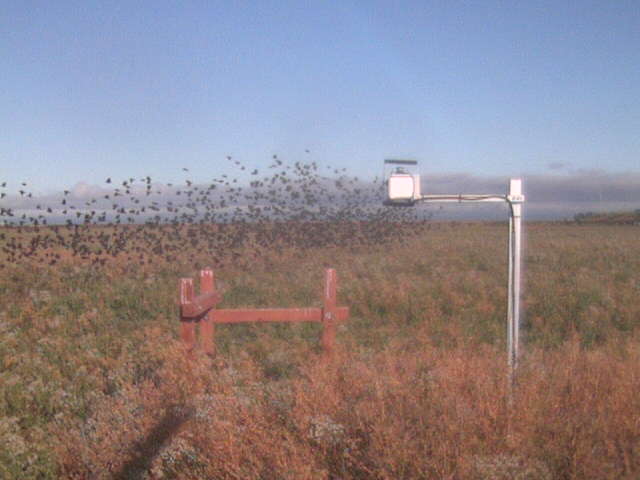
SI_webcam_20102230715.jpg ( 2010-08-11 07:15:06 ) Full size: 640x480
Black bird flock
7 sets found
1 SI_mp graphs found
11 SI_met graphs found
Can't check SI_mixed
2 SI_mixed graphs found
5 SI_flx graphs found
2 SI_soilco2 graphs found
Can't check TWSI_mixed
Can't check SIMBTWEE_met