Field Notes
<--2010-08-11 09:30:00 | 2010-08-28 11:56:00-->Other sites visited today: Twitchell Rice
Phenocam link: Searching...
Sherman Island: 2010-08-17 12:00:00 (DOY 229)
Author: Joe Verfaillie
Others: Jaclyn, Dennis
| Sherman 8/17/2010 I arrived about 12 noon with Dennis and Jaclyn. It was clear, sunny and cool with a strong west wind, stronger than at Twitchell. The field is dry with some water in the ditches at the far west end. Cows in the far west end. Big tire tracks in the weeds from the gate to the east of our cow fence. The ditch along the road is as full as I have ever seen it. Everything was running well. The LGR read: 11:08PST, 25.59C, 143.13Torr, 15.660usec, 10Hz, 1.830ppm I swapped the LI7500 for calibration: sn 0041 came off and sn 0976 went on. I tried to calibrate the LGR, but low flow pressure was 69Torr and falling with almost undetectable flow from the outlet of the internal pump. I brought out the two solar panels from the corner where the soil moisture probes are. The battery was too heavy to carry out today. We left about 1pm. |
4 photos found

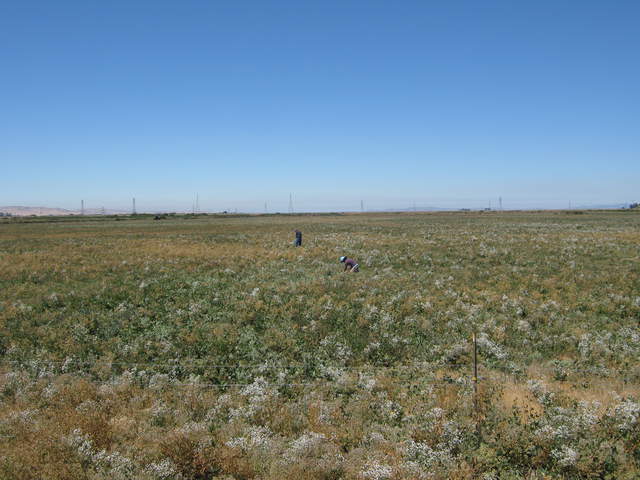
20100817SI_DennisJaclynField.jpg ( 2010-08-17 12:28:28 ) Full size: 3648x2736
Dennis and Jaclyn in the field.

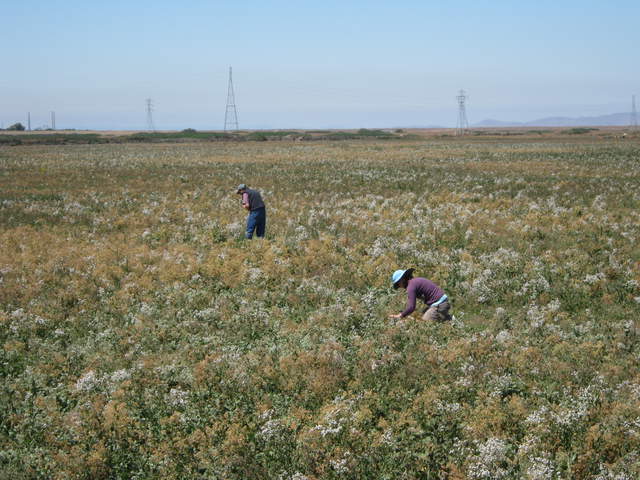
20100817SI_DennisJaclynFieldZoom.jpg ( 2010-08-17 12:28:36 ) Full size: 3648x2736
Dennis and Jaclyn in the field.

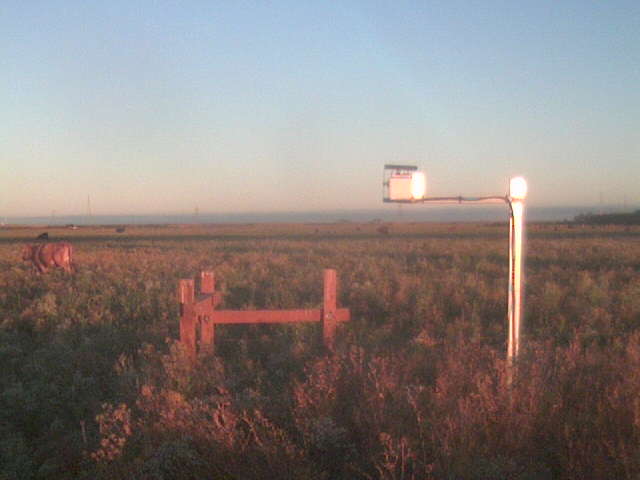
SI_webcam_20102280545.jpg ( 2010-08-16 05:45:02 ) Full size: 640x480
Bridge shadow.

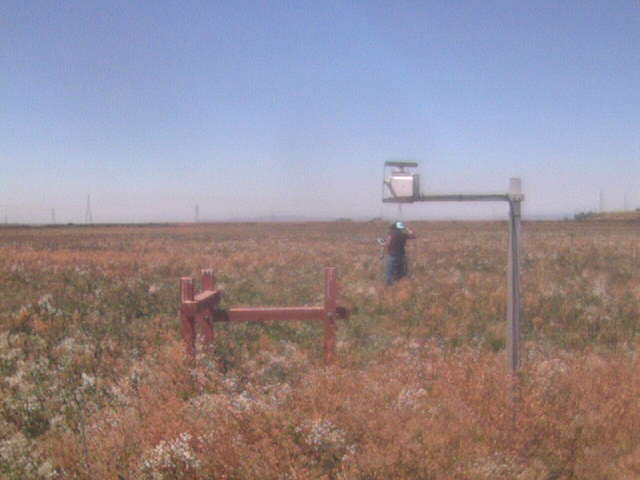
SI_webcam_20102291145.jpg ( 2010-08-17 11:45:04 ) Full size: 640x480
Fieldwork at the cow pasture
7 sets found
1 SI_mp graphs found
11 SI_met graphs found
Can't check SI_mixed
2 SI_mixed graphs found
5 SI_flx graphs found
2 SI_soilco2 graphs found
Can't check TWSI_mixed
Can't check SIMBTWEE_met

